 My Cart
 Understanding Spectrometer Resolution Specifications
Resolution is one of the key specifications discussed in a spectrometer purchase decision. But resolution specifications can be overstated by manufacturers if the proper means of measuring resolution is not well understood by spectrometer buyers. For one thing, maximizing resolution might not be recommended for specific applications and can actually impede performance. The purpose of this article is to clarify resolution specifications, how they are measured and what to watch for when evaluating the resolution of a spectrometer for your application.
What is Resolution?
Among the many applications of spectroscopy, we encounter many different types of resolution ranging from temporal, spatial and spectral resolution. When evaluating a spectrometer instrument, the optical resolving power of the instrument is key. This is known as spectral resolution and is normally defined as the minimum spectral separation between peaks that the instrument can resolve. The resolution of a spectrometer is expressed in the following: R=λ/Δλ
When is Resolution Important, or Not?
The spectral resolution of an instrument can mean the difference between making the correct identification of a molecular fingerprint or not, or between two or more atomic lines. For applications such as laser induced breakdown spectroscopy, Raman, and optical emission spectroscopy, relatively high resolution is very important. Conversely other applications such as colorimetry, fluorescence and radiometry normally do not demand high resolution. In fact some applications in this later group actually demand lower resolution such that higher resolution configurations will actually hamper success by slowing down a measurement or oversampling such that signal to noise may be negatively affected.
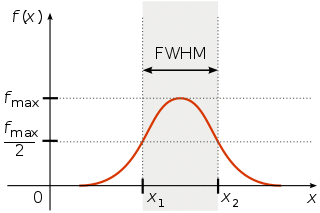
Arne Nordmann (norro), CC BY-SA 3.0, via Wikimedia Commons
What is the correct way to measure resolution?
Resolution values for a spectrometer are determined by measuring the Full Width Half Maximum (FWHM) of a peak. This is done by measuring the width of the peak at the half of the maximal peak intensity.
Practically speaking, resolution is normally measured using a gas atomic emission source such as a mercury argon source, or alternatively with a tunable laser as the illuminant and projecting this light into the spectrometer through the slit. The spectrometer is optimized for integration time and some or all of the spectral peaks are measured for their full width at half maximum. An average of these values may be used or a mid-point value representing median resolution may be stated as the spectrometer resolution. Avantes measures all instruments for resolution to ensure that published resolution values are based on actual statistics rather than theoretical values.
Why do Resolution Specifications Differ Between Instrument Manufacturers?
The difference between theorical and measured values is the biggest reason for disparity between spectrometer specifications from different manufacturers. Assuming similar focal length optical benches, similar gratings and slit sizes, resolution specifications can vary somewhat but should not be drastically different. Given the importance of resolution to many spectroscopy applications, the tendency toward hyperbole may influence the specifications of many instrument manufacturers.
Theoretically, resolution can be calculated given the configuration parameters of a spectrometer but there can be great disparity in the methods of calculation.
Pixel Resolution
In the most generous theoretical calculations, known as pixel resolution, the range of the instrument is divided by the number of pixels and this provides a value which may be used to specify resolution. For example, with a broadband spectrometer covering 200-1100 nm of range (for a total of 900 nm), a 2048 pixel array provides for 0.44 nm of pixel resolution and and 4096 pixels array would provide 0.22 nm of pixel resolution. This method of resolution calculation is not well regarded by spectroscopists and should not be relied on for an accurate calculation of an instrument’s actual resolution.

Figure 1: Dispersion curves for Avantes 300 groove/mm gratings
Dispersion
A more accurate but still theoretical calculation involves the pixel dispersion of the grating where these values may be derived from the grating parameters. In Figure 1 below the grating dispersion for Avantes 300 groove/mm gratings is shown. At the mid point of a broadband 200-1100 nm configuration the dispersion is around 0.57 nm/pixel. Following this method, the dispersion curve would suggest that resolution of 0.57 nm would be possible for a 300 groove/mm grating. Dispersion is an component of a resoluiton calculation but it does not define resolution.
Calculated Resolution
A third and final method of resolution calculation involves the use of the grating dispersion curve values shown in Figure 1 along with the slit width and magnification of the optical bench. While this method is certainly the most realistic of the theoretical methods, it still assumes the theoretical optimization of all parts of the spectrometer such that the calculated resolution values are often overstated.
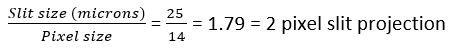
Calculation Example
- Slit size = 25 microns
- Bandpass = 200-1100 nm (900 nm total)
- Pixel size (width) = 14 microns
- Number of pixels – 2048
- Grating: 300 grooves/mm
- Optical bench magnification: 0 (AvaBench ultra low stray light 75 mm)
![]()
Theoretical calculations assume that the slit image is perfectly aligned on each pixel but in reality this assumption is normally not possible. In many cases, peaks are not perfectly aligned on pixels, but are rather divided between two or more pixels thus causing the overall intensity of the peak to be divided. This can make it difficult to determine the exact peak position thus influencing the measured FWHM. Furthermore, the theoretical calculation provides no separation between adjacent peaks.
Below, Table 1 is an example of a peak measurement at 253 nm which demonstrates the differences between theoretical and measured resolution for a broadband spectrometer with different slit sizes.
The third column labeled specification is Avantes published resolution specification which is more conservative. This example demonstrates Avantes commitment to an honest specification that can be achieved and exceeded (in most cases) rather than overpromising and underdelivering.
| Resolution (nm) | Theory | Measured | Specification |
|---|---|---|---|
| Slit 10 | 0.44 | 0.69 | 1 |
| Slit 25 | 0.86 | 1.27 | 1.4 |
| Slit 50 | 1.76 | 2.3 | 2.5 |
| Slit 100 | 3.52 | 4.37 | 4.8 |
- Based on broadband 200-1100nm configured spectrometer.
Table 1: Resolution for various slit sizes on AvaSpec-ULS2048CL-EVO spectrometer with broadband UA (200-1100 nm) grating
The Avantes AvaSpec series of spectrometers, provides a wide variety of performance characteristics ranging from the very high resolution StarLine, like the AvaSpec-ULS4069CL-EVO, to high sensitivity (and lower resolution) SenseLine instruments such as the AvaSpec-Hero ( HSC1024X58-TEC-EVO). Avantes Sales Engineers work closely with our customers to find the optimum balance of resolution and sensitivity for each application with the goal of meeting and exceeding your specifications. We will never do this by exaggerating our specifications. Please contact a Sales Engineer for more information about our AvaSpec instruments.
Questions about Resolution?
Do you want to know more about choosing the right resolution instrument to match your application needs? Speak with an expert Avantes Sales Engineer now.