Season of Lights: Christmas Light Irradiance Measurements
Conducted by: David Ademe, Avantes Inc.
Theme: LED’s/Irradiance
Background/Applications:
Spectral irradiance is the irradiance of a surface per unit frequency or wavelength, depending on whether the spectrum is taken as a function of frequency or of wavelength. The two forms have different dimensions: spectral irradiance of a frequency spectrum is measured in watts per square meter per hertz (W·m−2·Hz−1), while spectral irradiance of a wavelength spectrum is measured in watts per square meter per meter (W·m−3), or more commonly watts per square meter per nanometer (W·m−2·nm−1). Irradiance is often called intensity because it has the same physical dimension.
Irradiance measurements are an excellent tool in determining the energy efficiency of light sources, such as common light sources used in an average household environment, especially at this time of year when many people celebrate the holidays with large displays of light. In this experiment, we will visualize just how energy efficient store-bought holiday lights are.
Description of System:
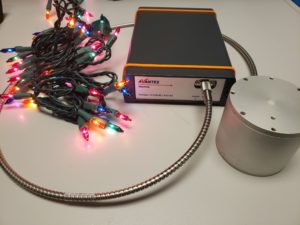
Figure 1: The setup for the experiment.
In this setup, we will be using an AvaSphere-50-IRRAD to collect the light. The basic principle is that light enters the sphere through the sample port, goes through multiple reflections on the highly reflective, Lambertian surface of the sphere and is scattered uniformly around the interior of the sphere. Behind a baffled port inside the sphere which is independent of the angular properties of the sample port, a fiber-optic cable collects a homogenized light signal and carries it to the spectrometer. The baffle is very significant as it prevents first reflections from entering the detection fiber. The AvaSphere series integrating spheres are available with active diameters of 30, 50 and 80 mm and an SMA port at 90 degrees for collecting the irradiance and reflection signals. The sample port diameters are 6 mm for the AvaSphere-30, 10 mm for the AvaSphere-50 and 15 mm for the AvaSphere-80. All sample ports are knife-edge, ensuring a near 180-degree field of view of the sample port. The irradiance version of the integrating sphere can be used for measurements of light sources, such as lasers, LEDs and incandescent sources. For irradiance measurements of 5 mm cylindrical LEDs, a special adapter is available for the AvaSphere-50/80-IRRAD. This adapter ensures correct and reproducible positioning of the LEDs inside the sphere. The inside of the integrating spheres is made of a highly reflective diffuse PTFE material. This provides over 96% reflectance over a wide wavelength range of 250-2500 nm. For the AvaSphere-50-REFL a special black gloss-trap is available to exclude specular reflection in the measurement.
This integrating sphere will be coupled to an AvaSpec-ULS2048CL-EVO via a FC-UVIR600-1-MS fiber. Using CMOS instead of the conventional CCD technology, this spectrometer is completely up to date and ready for the next decade. In combination with our latest AS-7010 electronics, the AvaSpec-ULS0248CL-EVO offers you a versatile device including USB3.0 communication with 10 times higher speed compared to USB2, and a second communication port which offers Gigabit Ethernet for integration in your company network and possibility for long distance communication, all at an affordable price.
The unit used in this experiment is configured with a VA grating with a range of 300 nm to 1100 nm, ideal for the visible range. A 25-um slit is fit on this spectrometer and is also configured with a DCL-UV/VIS-200 (a quartz detector collection lens) and an OSC-UA (order-sorting coating Linear Variable Filter made for UA and VA gratings)
An irradiance calibration will also be performed on this setup to ensure accurate intensity measurements are being recorded.
Description of Methodology:
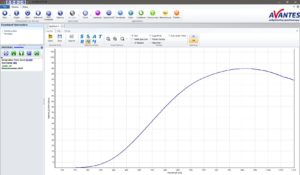
Figure 2: The absolute irradiance curve from the calibration performed in the Avantes Inc calibration lab.
For this experiment, the Avantes software AvaSoft was utilized. Within AvaSoft, there are various modules for different types of spectroscopic measurements. One of the modules in AvaSoft is Absolute Irradiance, which is specifically designed to collect irradiance intensity related data.
This system has been calibrated in-house in our calibration lab. This will ensure reliable irradiance data is being collected. The image below (figure 2) shows the intensity curve after the unit has been calibrated in-house.
After the setup has been irradiance calibrated, the integrating sphere is placed over the LED light and the cheaper store-bought holiday strand of lights.
Test Data and Results:
- Integration Time: 25 ms
- Averaging: 20
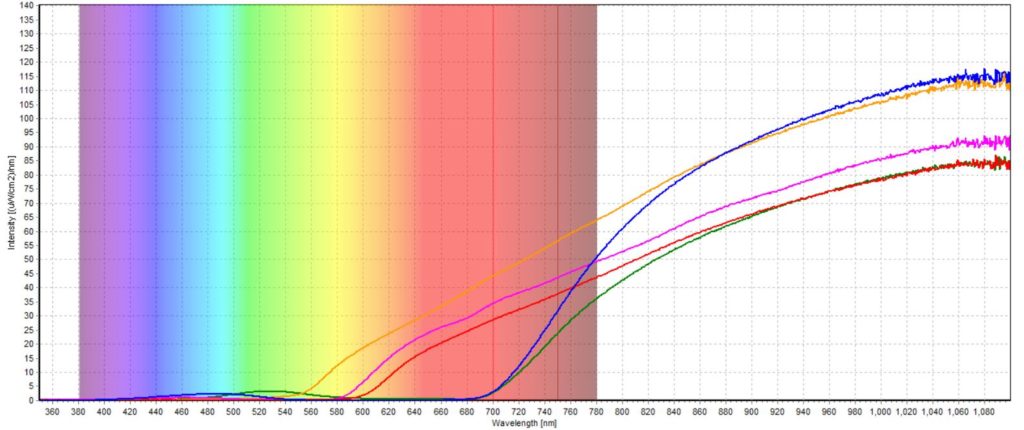
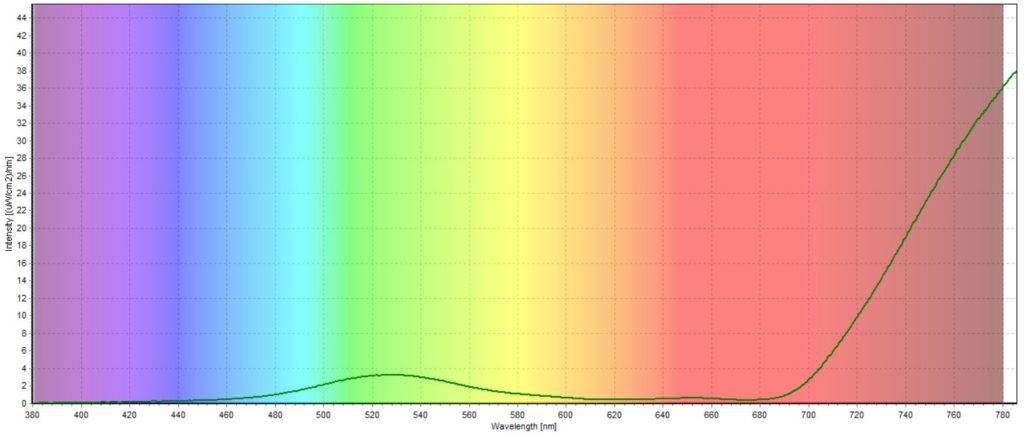
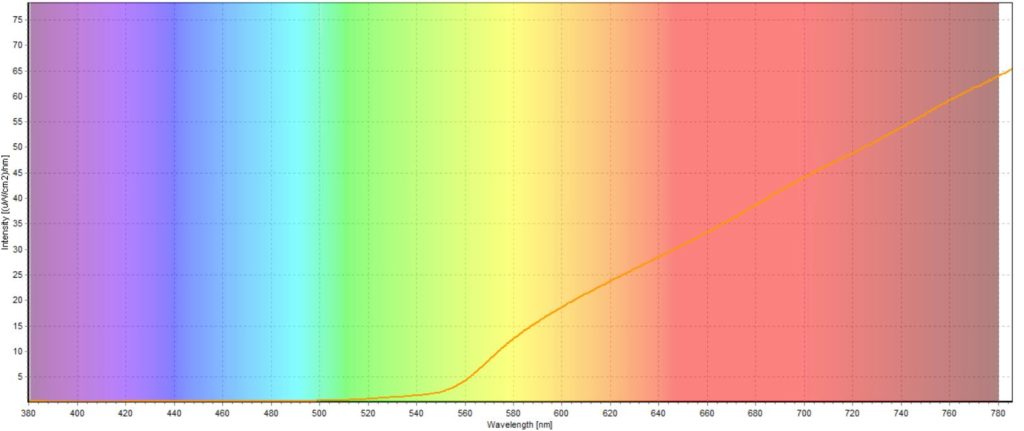
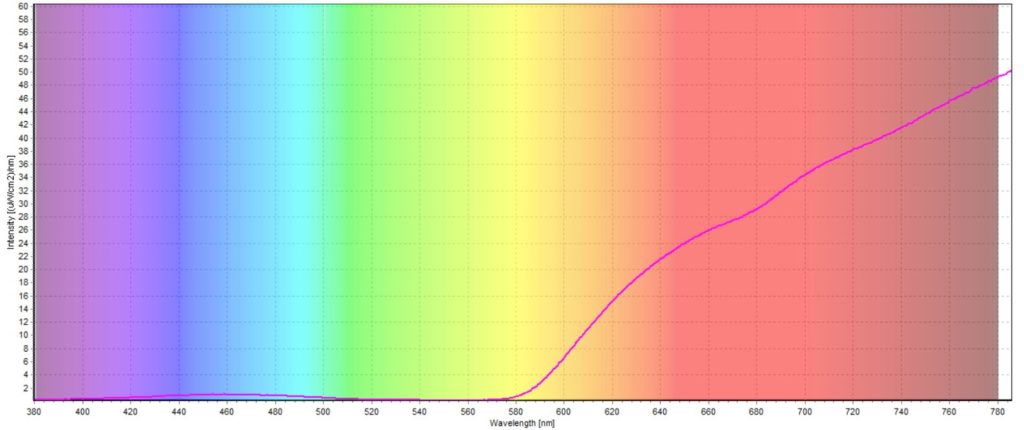
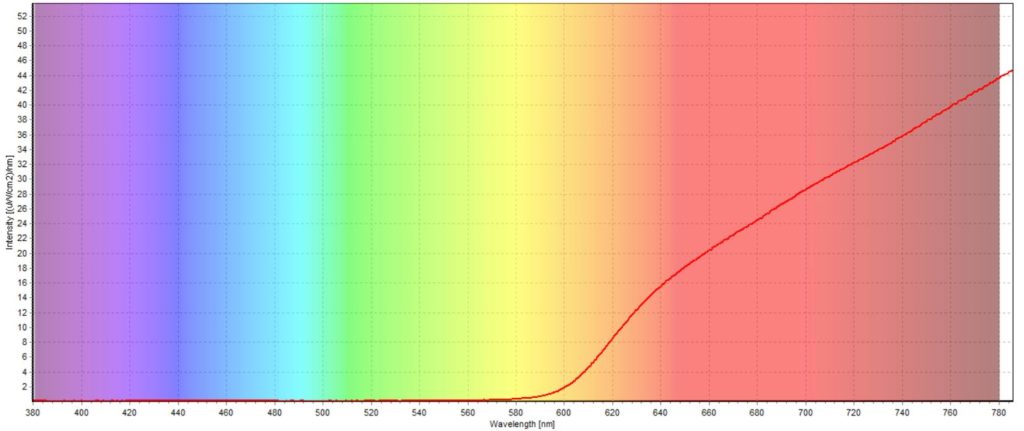
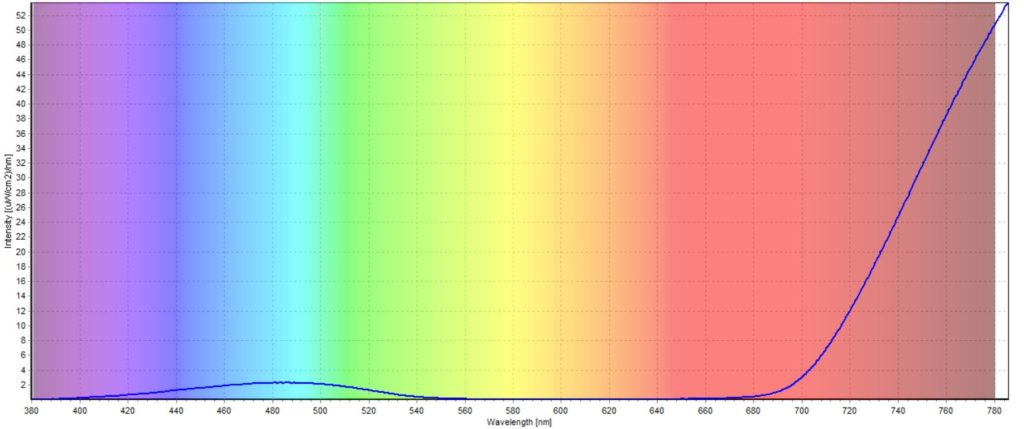
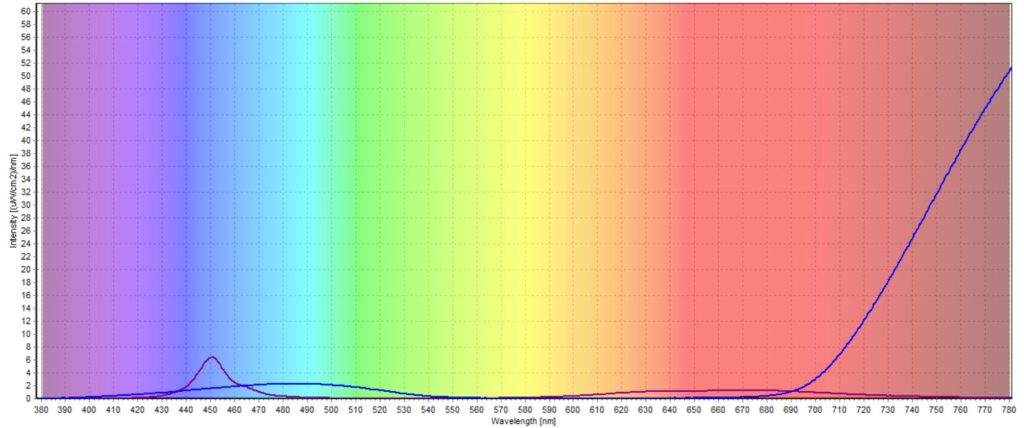
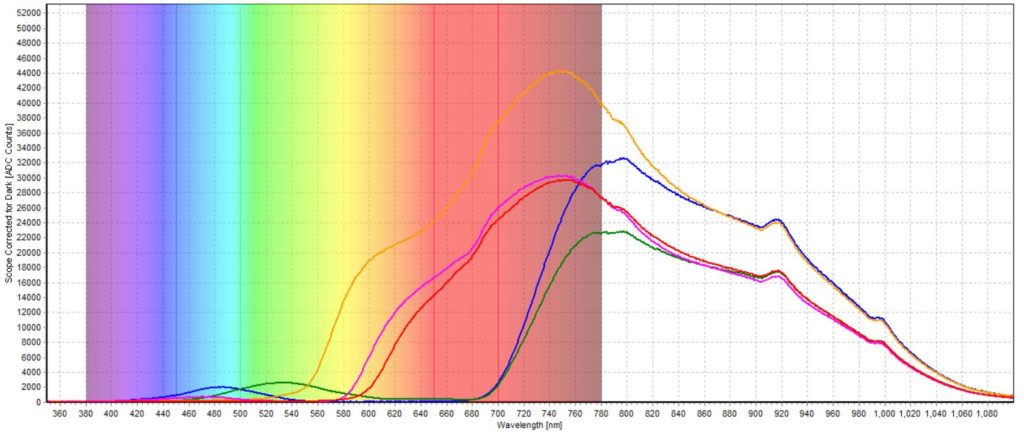
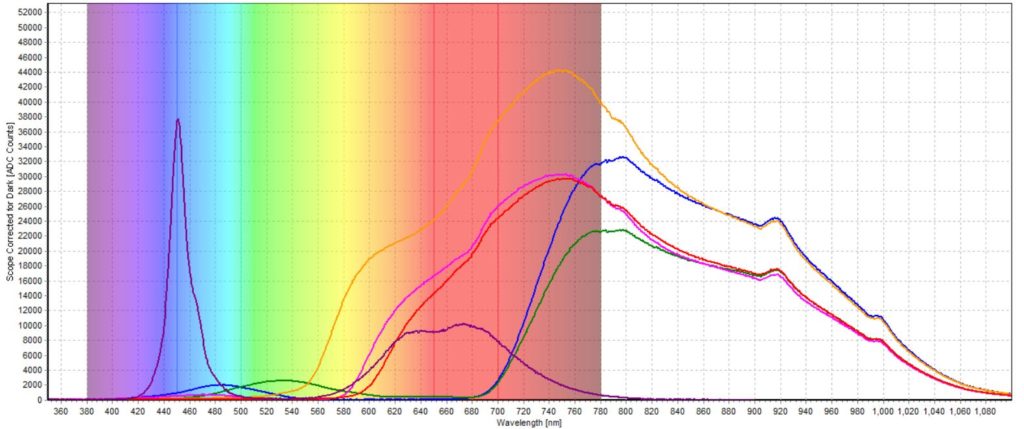
Scope data and irradiance spectra collected from the light sources.
Analysis:
It is quite surprising to see just how different each color of light is on the strand of holiday lights. Another surprising aspect of the spectra is just how much light is given off in the NIR region outside of the visible band of light. The absolute irradiance data shows the intensity for the strand of lights is much higher in the NIR range than in the visible range. When comparing the spectrum to an LED from a blue strand of lights, it is very clear just how much more energy efficient LED’s are than a standard store bought or incandescent light source. For example, figure 8 shows the blue LED intensity compared to the intensity of the blue bulb in the strand of lights. The intensity is equivalent in the visible range, while the LED gives off no energy in the NIR region. This shows how much more efficient LED’s are. When setting up a large display of lights, ensuring you are using LED’s will help you keep your energy costs down.
Conclusion:
In conclusion, the AvaSpec-ULS2048CL-EVO and AvaSphere integrating sphere do an excellent job at capturing reliable irradiance spectra which can be used to determine the energy efficiency of various light sources. Irradiance data may even surprise you in what you find out. The irradiance calibration which is performed in-house at Avantes’ calibration lab can help you get reliable irradiance spectra.
Get the Downloadable Datafiles
Design your Ideal Spectroscopy System
Speak with an applications expert today!
 My Cart
