 My Cart
 NIR Grain Analysis
Conducted by: David Ademe, Avantes Inc.
Theme: Grains/Agriculture
Background/Applications:
Absorption and reflection measurements can be used to determine the freshness of various crops, from fruits and vegetables to even grains. Not only can reflection and absorption spectra be used to identify the properties of different types of grains through chemometric models, but it can also be used to characterize the unique spectra of each sample. NIR spectroscopy is leading the way for the future of agriculture and food production for both qualitative and quantitative measurements.
Description of System:
A halogen light source is ideal for absorption measurements because of its power and good output in the NIR range, which is the wavelength range many researchers use in agriculture to study and characterize crops. The halogen light source used in this testing is integrated within our Avantes integrating sphere, an Avantes AvaSphere-50-LS-HAL. This integrating sphere and light source combination provides an excellent reading of reflection and absorption data across a larger surface when compared to a reflection probe. The integrating sphere is connected via SMA termination to a bifurcated fiber, with one leg connected to an AvaSpec-ULS2048x16 and an AvaSpec-NIR256-1.7-HSC-EVO. Both spectrometers are combined via AvaSoft to create a single spectrum providing high resolution across a wide wavelength range. If a greater wavelength range was desired to be measured, it would be possible to combine/merge even more detectors to create a single spectrum.
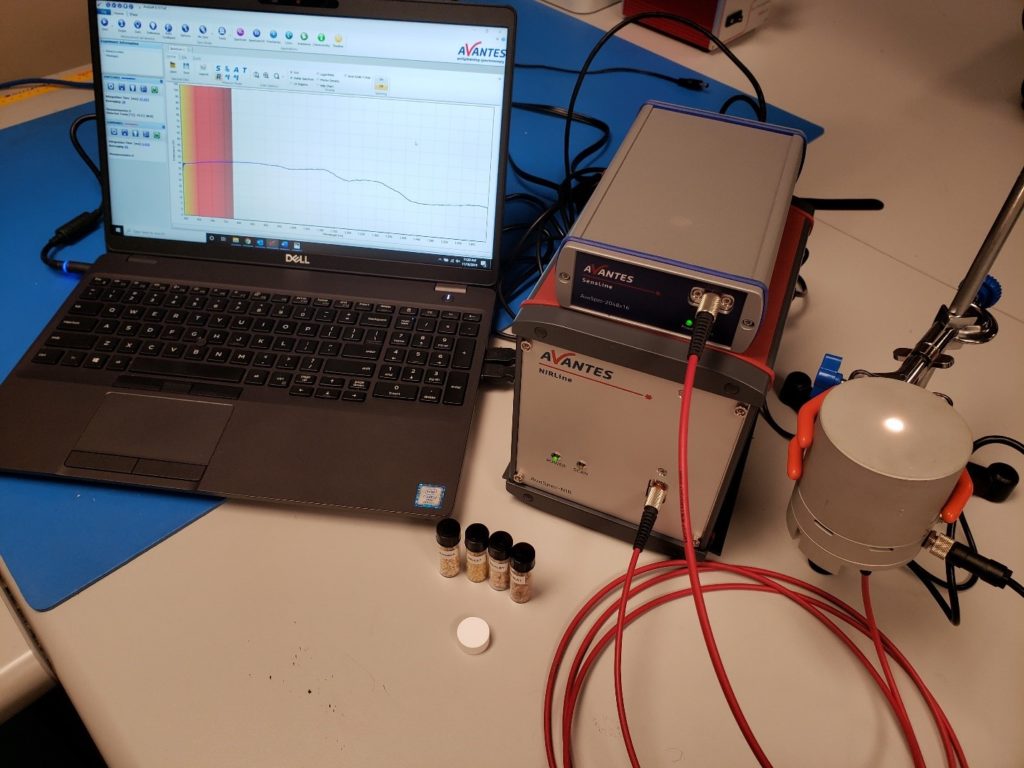
Figure 1: The setup of the experiment.
A xenon source may be used for agriculture measurements as well. However, it is important to utilize a higher number of averages during the measurement process as it is a pulsed light source which requires a higher averaging in order to achieve a stable output.
The AvaSpec-ULS2048x16 is the best option when looking for a cost-effective, highly sensitive spectrometer. The back-thinned Hamamatsu detector features a signal-to-noise ratio of 500:1 and a quantum efficiency of up to 78%. The specific unit used in this experiment is fitted with an IB grating with a range of 600 nm to 1112 nm. An OSF-600 to reduce second-order effects is also implemented in this unit. The AvaSpec-ULS2048x16 is useful for measuring the third overtone of the near-infrared (800-1100 nm) which provides for an economical means of analyzing grains.
The AvaSpec-NIR256-1.7-HSC-EVO is equipped with thermoelectric, Peltier-cooled 256-pixel InGaAs detector which supports cooling down to -25°C against ambient. The AvaSpec-NIR256/512-1.7-HSC-EVO spectrometers pair the same trusted InGaAs array detectors with our ultra-low-noise electronics board, featuring a USB3 and Giga-Ethernet connection port. The instruments are equipped with a Replaceable Slit. Digital and analog I/O ports enable external triggering and control over the shutter and pulsed light sources. Choose from two distinct software-controlled gain-setting modes: high-sensitivity mode (HS, default) and the low-noise mode (LN). Cooling ensures optimal noise conditions, even at longer integration times. All NIR-1.7 instruments are available with a choice of four different gratings, making it possible to choose the bandwidth fitting your application.
Description of Methodology:
For this experiment, the Avantes software AvaSoft was utilized. Within AvaSoft, there are various modules for different types of spectroscopic measurements. One of the modules in AvaSoft is Absorbance Mode, which is specifically designed to collect absorbance related data.
Our dual-channel setup will be used to measure the absorbance spectrum from four different grain samples: barley, millet, quinoa, and wheat. A white WS-2 tile will be placed on the port of the integrating sphere to optimize the integration time and averaging for each channel. This tile will then serve as a reference for collecting the absorbance spectrum of each of the four samples.
It is important to note that diffuse reflectance will be measured in this experiment and not spectral reflectance. Diffuse reflectance refers to most of the colors we perceive from objects. Materials and objects with a rough surface display diffuse reflection, where light is reflected at a wide range of angles. Spectral reflectance refers to the phenomenon we see when looking at a mirror. The angle of reflection of the light is equivalent to the angle of incidence. Materials and surfaces that we perceive with a matte coating display diffuse reflectance, whereas samples with a glossy texture display a combination of diffuse and specular properties. Mirrors are an excellent example of a purely specular reflective material.
Test Data and Results:
Displayed below is the reflectance and absorption spectrum collected from the four grain samples.
| Integration time (AvaSpec-2048×16) | 5.50 ms |
| Integration time (AvaSpec-NIR256-1.7-HSC-EVO) | 27.20 ms, Low Noise Mode |
| Averaging | 20 |
Spectra results of NIR grain analysis conducted in November 2019 for Spectra of the Month Feature


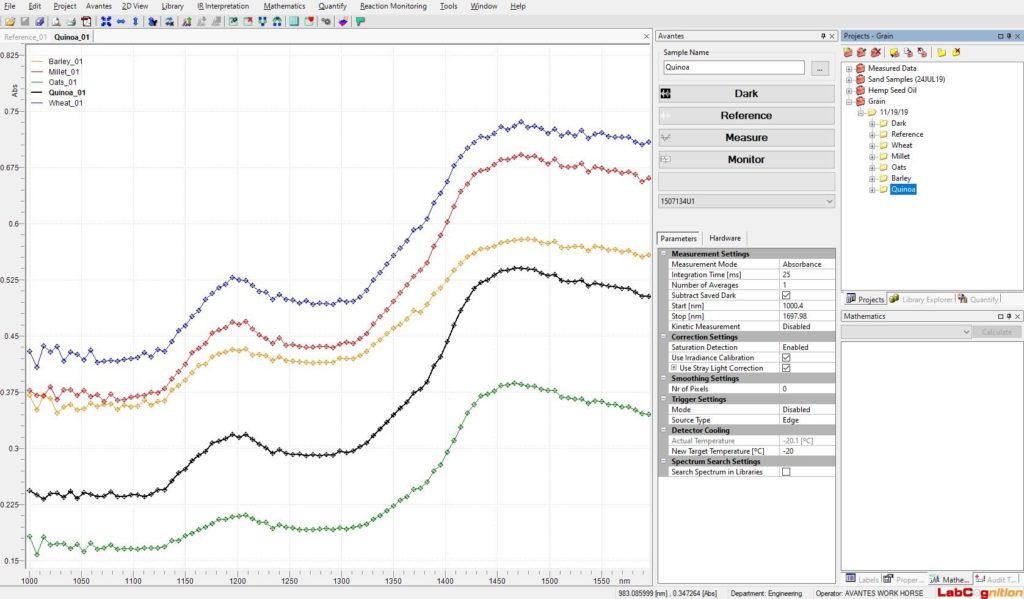
Figure 14: An example of an absorption chemometric model developed for identifying various types of grains.
Analysis:
While each grain sample appears similar to one another, such as sharing the same peaks and valleys, it is visible that each sample has its own unique spectral fingerprint. This can be used to identify grains and test the grains for wellness and distribution. For example, a standard may be set that each sample must meet the specified parameters to pass a quality check.
Next steps could include developing a chemometric model of each grain sample, which can then be used to identify unknown grain samples. For the data collected on our five samples, a PCA report was compiled to identify the type of grain being examined according to our absorbance spectra. Ten spectra of each sample were used to compile the PCA report, resulting in an R² value of .999, allowing us to conclude our chemometric model is an accurate method to identify various grain samples. Our model also shows how each sample is unique from one another in ways that may not be visible at a first, top-level glance at the data. Chemometric software, such as LabCognition’s Panorama, is a powerful tool that allows you to apply various mathematic methods to your data in order to generate a reliable model for future identification and quantification of your spectra.
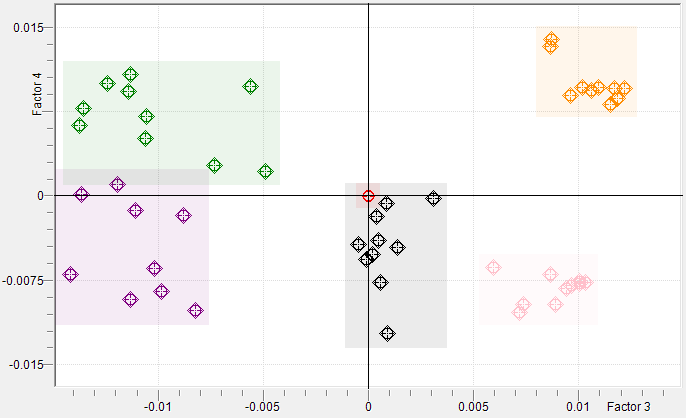
Figure 15: A factor score plot showcasing the difference and uniqueness of the spectra for all five samples.
Conclusion:
In conclusion, the AvaSpec-ULS2048x16 and AvaSpec-NIR256-1.7-HSC-EVO spectrometers in combination, in addition to AvaSoft and chemometric software, can collect extremely accurate reflection and absorbance data that can give you critical understanding of your sample. This technique on collecting reflection data can be applied to a wide range of industries and fields, including optics, medical diagnostics, food and agriculture, and biology.
Learn more about using Spectroscopy for your agriculture application
Speak with our knowledgeable experts about the unique needs of your application and learn how we can design a system around your measurement requirements