 My Cart
 Buckets of Blood: Absorbance Spectra Comparison with Fake Blood
This month’s spectra celebrates the Halloween season as we measure spectra results obtained from BLOOD!
Background/Applications:
Absorption spectroscopy is used across a wide range of industries and is an effective form of scientific analysis in many fields of research. This includes the medical field for studying blood. For example, absorbance spectroscopy has been used to determine total hemoglobin as well as oxygenated and deoxygenated hemoglobin in red blood cells. This information can be useful in providing details about the physiological state. For example, at the wavelengths 550nm and 570nm, the absorption spectra for oxygenated and deoxygenated hemoglobin are equal. These peaks provide information on total hemoglobin. Between 610nm and 630nm, the absorption spectra for oxygenated hemoglobin is almost zero whereas there is a small amount of absorption for deoxygenated hemoglobin. Comparing these two spectrums can be used to provide critical information on changes between oxygenated and deoxygenated blood.
Description of System:
A halogen light source is ideal for absorbance measurements because of its power and good output between the wavelengths of 380nm-1700nm, which is the wavelength range many experts use to study human blood. Valuable information can be gain from the visible range to the NIR range. The halogen light source used in this testing, an Avantes AvaLight-HAL-S-Mini, is connected via an SMA termination to a cuvette holder. VIS/NIR fibers are perfectly suited for this application as they are both capable of transmitting light within the 380nm-1700nm range. The cuvette holder will hold our fake blood sample in a quartz cuvette. The opposite end of the cuvette holder will be connected via SMA termination to a bifurcated 400um core diameter fiber. This bifurcated fiber is then connected to an AvaSpec-ULS2048x64TEC and an AvaSpec-NIR512-1.7-HSC-EVO, both equipped with a 25um slit. With Avantes spectrometers, it is possible to merge the spectrum from multiple units to create a single spectrum, allowing the user to achieve both high sensitivity and high resolution.
A xenon source may be used for blood/biomedical measurements as well. However, it is important to utilize a higher number of averages during the measurement process as it is a pulsed light source which requires a higher averaging in order to achieve a stable output.
The AvaSpec-ULS2048x64TEC is equipped with a cooled, back-thinned detector. The back-thinned detector has good sensitivity in the UV and IR regions. This instrument features our redesigned triple-stage Peltier cooling device integrated into our exclusive ultra-low stray light optical bench, which can reduce the temperature of the CCD chip by -35 °C against ambient, improving the dark baseline and PRNU level significantly. The detector cooling also reduces the dark noise by a factor of 2-3. The AvaSpec-ULS2048x64TEC-USB2 uses a special low noise version of the 2048×64 detector. All these features make this instrument ideally suited for measuring low-light applications like fluorescence, for instance. The specific unit used in this experiment is fitted with a BB grating with a range of 380nm to 780 nm. An OSC with a 600nm long-pass filter has also been built into this unit’s configuration.
The AvaSpec-NIR512-1.7-HSC-EVO is equipped with thermoelectric, Peltier-cooled 512-pixel InGaAs detector which support cooling down to -25°C against ambient. The AvaSpec-NIR256/512-1.7-HSC-EVO spectrometers pair the same trusted InGaAs array detectors with our ultra-low-noise electronics board, featuring a USB3 and Giga-Ethernet connection port. The instruments are equipped with a Replaceable Slit. Digital and analog I/O ports enable external triggering and control over the shutter and pulsed light sources. Choose from two distinct software-controlled gain-setting modes: high-sensitivity mode (HS, default) and the low-noise mode (LN).
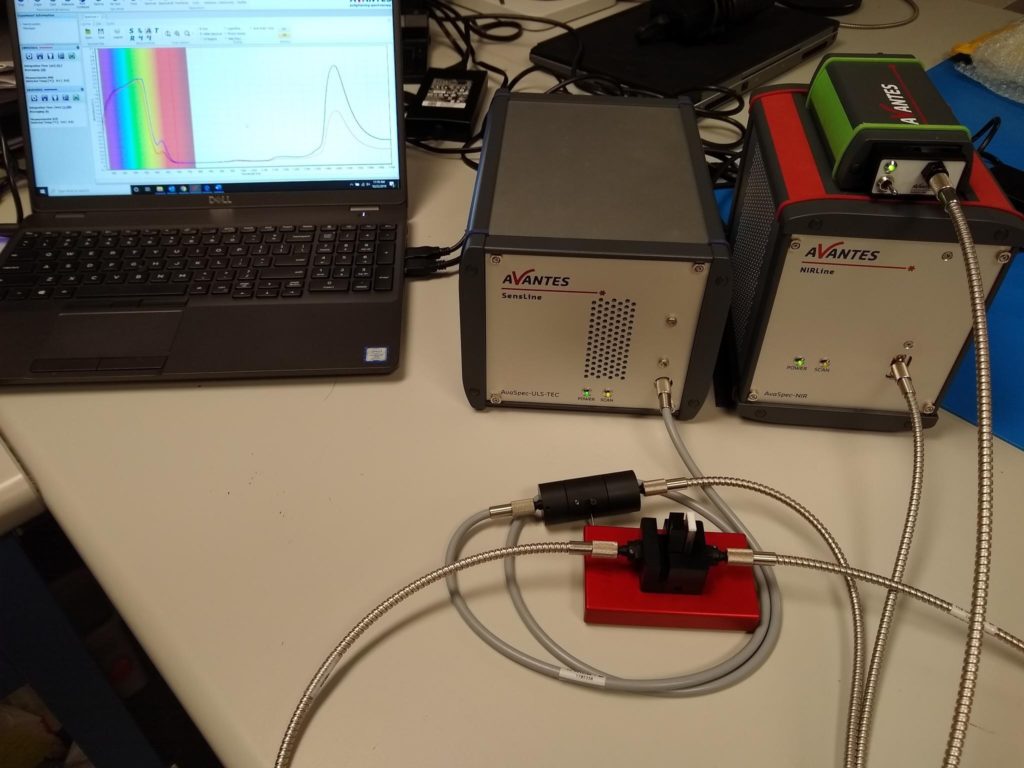
Figure 1: The setup of the experiment.
Description of Methodology:
For this experiment, the Avantes software AvaSoft was utilized. Within AvaSoft, there are various modules for different types of spectroscopic measurements. One of the modules in AvaSoft is built Absorbance Mode, which is specifically designed to collect absorbance related data.
Absorbance spectroscopy involves light being directed at an object, passing through the sample and being collected by the detector on the other side. Some light is absorbed, reflected and transmitted. The detector on the other side will be able to measure which wavelength bands of light have been absorbed by the sample being tested. A sample of liquid or gas will contain a number of chemical elements, compounds and molecules. Individual chemical elements and compounds have a unique fingerprint when a known light source is passed through the element and detected on the other side. These spectral signatures can inform scientists which elements and compounds are present in a sample.
To demonstrate the capabilities of the Absorbance Mode module in AvaSoft, we have collected the absorbance spectrums of fake blood samples in both 1mm and 2mm path length cuvettes. The composition of this fake blood is primarily water, propylene glycol, red food coloring, blue food coloring and tetrasodium N. The spectrum from the fake blood will be compared with the actual spectrum of human blood. The absorbance data can then tell us just how much fake blood differs from human blood.
Test Data and Results:
Integration time (AvaSpec-2048x64TEC)
| Integration time (AvaSpec-2048x64TEC) | 10.00 ms |
| Integration time (AvaSpec-NIR512-HSC-EVO) | 1.500 ms |
| Averaging | 100 |
Displayed below is the absorbance spectrum collected from the testing of fake blood.
Legend (For Avasoft files): The red spectrum represents a cuvette with a 1mm path length, while the blue line represents a cuvette with a 2mm path length.
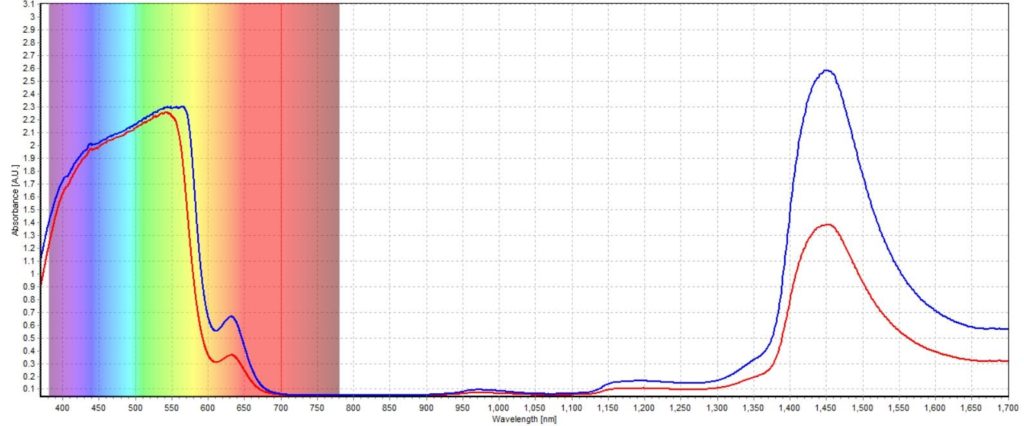
Figure 2: The absorbance spectrum of fake blood with a 1mm and 2mm path length cuvette.
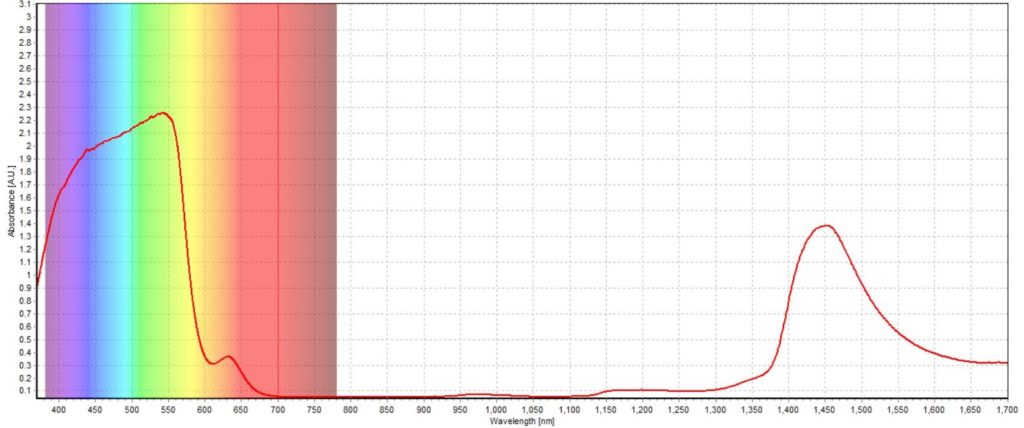
Figure 3: The absorbance spectrum of fake blood with a 1mm path length cuvette.
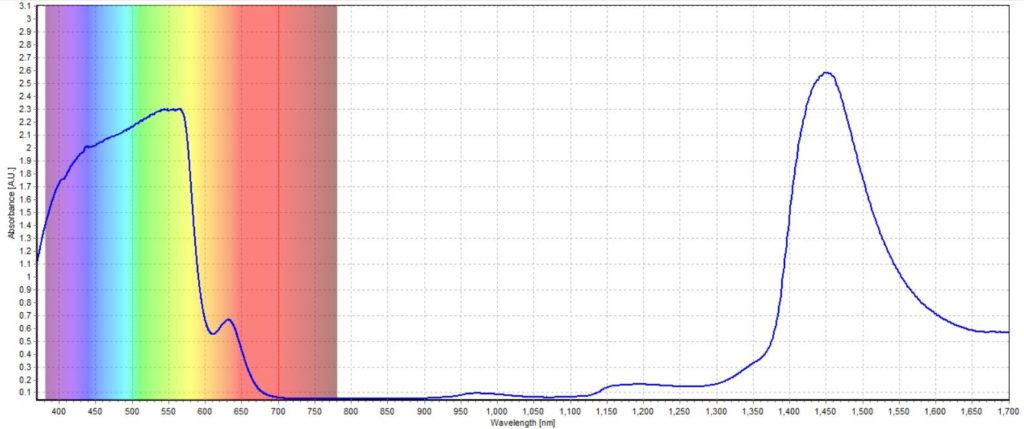
Figure 4: The absorbance spectrum of fake blood with a 2mm path length cuvette.
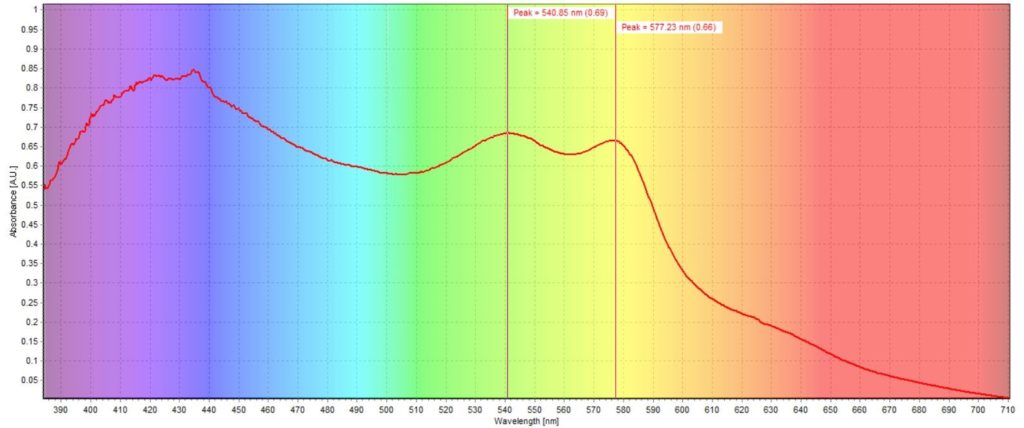
Figure 5: Avantes spectra of dried blood spot (DBS).
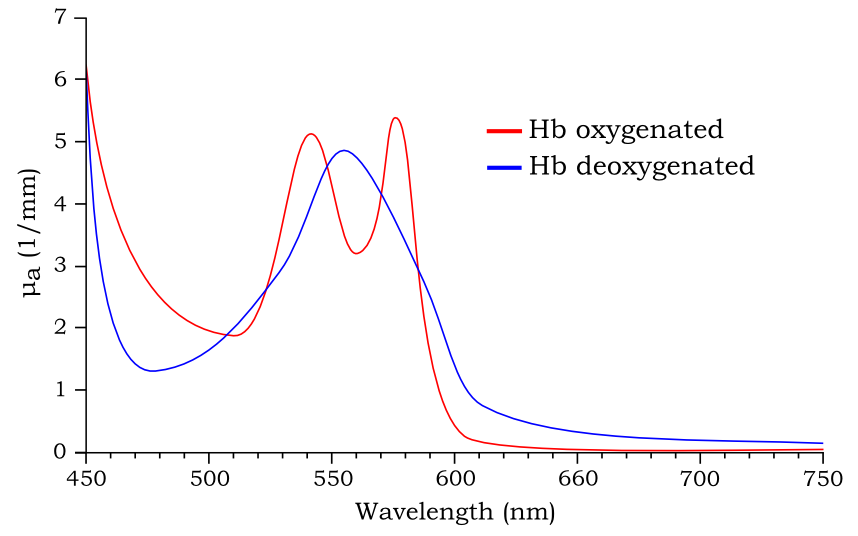
Figure 6: Spectra of oxygenated hemoglobin and deoxygenated hemoglobin.
Analysis:
Upon comparison of the fake blood absorbance spectra to that of real blood, the results are very interesting. The fake blood contains a peak of interest in the range of 450 nm to 600 nm, just like real blood. This peak we see at approximately 550 nm in the fake blood is very similar to that of deoxygenated hemoglobin. The absorbance spectrum between 610 nm and 630 nm is almost zero for the fake blood, which also compares similarly to deoxygenated hemoglobin. The peak at 1450 nm is another peak of interest for those studying deoxygenated vs oxygenated hemoglobin. When compared to the spectra taken of human blood, these two peaks at 540 nm and 580 nm are clearly visible. Dried blood spot (DBS) sampling is recognized as a valuable alternative sampling strategy both in research and in clinical routine, just as absorbance testing of blood. Therefore, the fake blood is a surprisingly good representation of real blood, not only in appearance but in its spectral fingerprint as well.
Conclusion:
In conclusion, the AvaSpec-2048x64TEC and AvaSpec-NIR512-1.7-HSC-EVO spectrometers in combination, along with the Absorbance Module in AvaSoft can collect extremely accurate absorbance data that can give you a critical understanding of your sample. This technique on collecting absorbance data can be applied to a wide range of industries and fields, including optics, medical diagnostics, food and agriculture, and biology.
Download the Complete Data File
Design your Ideal Spectroscopy System
Test Drive an Instrument Today! Speak with an Applications Expert Today!