This experiment utilized the AvaSpec-NIR512-2.5-HSC along with an AvaLight-HAL-S-Mini and a direct attach cuvette holder and a FC-UVIR400-1-BX fiber in order to collect data.
Figure 1: The Avantes setup used to conduct the experiment.
Methodology
For this experiment, we used the software application Panorama, developed by LabCognition. Panorama is a powerful spectroscopic tool capable of fully controlling Avantes instruments to give the user the ability to not only collect and save data, but compile this data into a multivariate chemometric calibration that is generated through the software and can be used for identification and quantitative prediction. This experiment used various CBD oil samples to generate a mathematical model capable of predicting the concentration of CBD in these samples.
The first step in this process was collecting the absorbance spectra of four samples. To create the model, each sample was measured a total of ten times. The base oil for these CBD oil samples is Hemp Seed Oil. Therefore, the hemp seed oil used to create these oils was used as the reference.
After collecting the spectra for each sample, the concentration of CBD in each oil (provided by the manufacturer who uses HPLC for a reference methodology) was entered with its respective sample. The Calibration Wizard in Panorama was then utilized to compile each sample into a mathematical model capable of predicting the concentration of CBD in each oil. For this calibration, a PLS1 model was used.
The following images show the various steps of the Calibration Wizard.
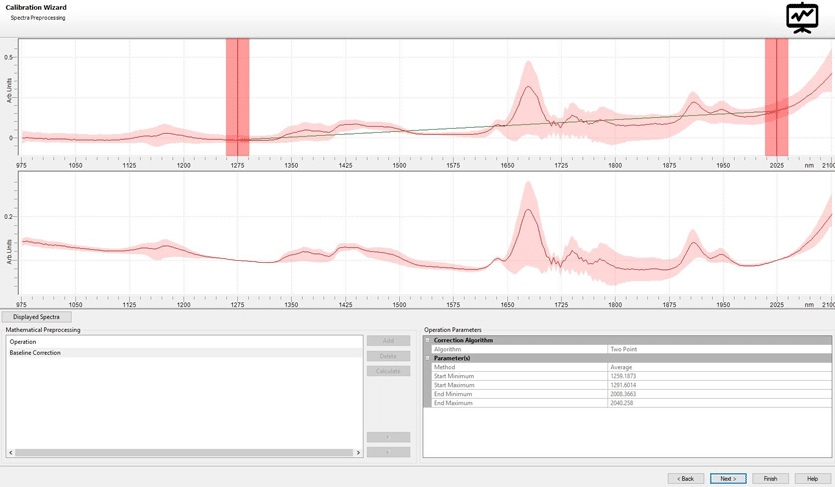
Fig. 2
The “Spectra Processing” screen of the Calibration Wizard in Panorama. Through this screen, various mathematical operations can be applied to refine your calibration model such as baseline correction, derivatives, normalization, smoothing, and convolution just to name a few.
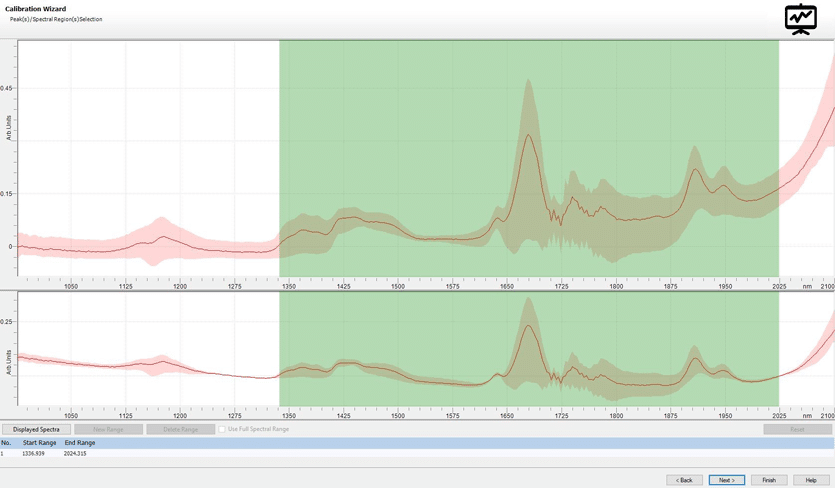
Fig. 3
The calibration wizard also allows you to select the spectral range of data you want to analyze and include in your calibration model. This is especially useful if you have a specific range that you are most interested in or have a smaller range you wish to use in your calibration.
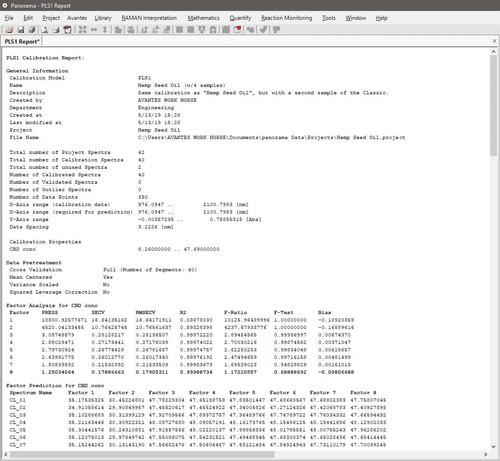
Fig. 4
The PLS1 report generated once the calibration model is complete.
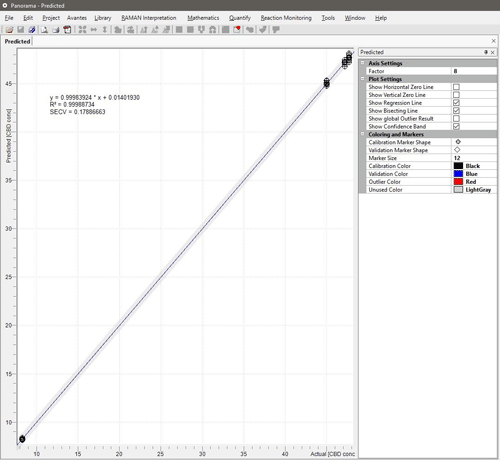
Fig. 5
Along with the PLS1 report, a predicted vs actual model is generated. With this calibration for CBD oil, we achieved an R^2 value of 0.99989. This means that our model is capable of identifying the concentration of CBD almost exactly.
Test Results
Once the calibration model was created, the calibration can be loaded into the spectra in order to calculate the percent concentration of CBD in your measurements. We performed measurements with new samples of each oil in order to test the accuracy of the calibration model.
Fig. 6
In order to test our calibration model, a sample of CBD oil was inserted into our setup. When measured, the calibration model predicted a CBD concentration of approximately 47.19 mg/mL. The actual concentration of this sample was 47.16 mg/mL. The concentration is displayed in the text box in the upper left corner.
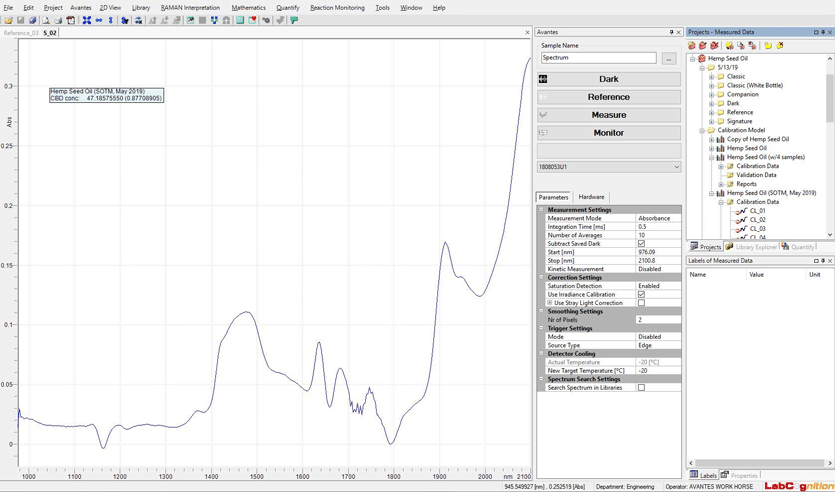
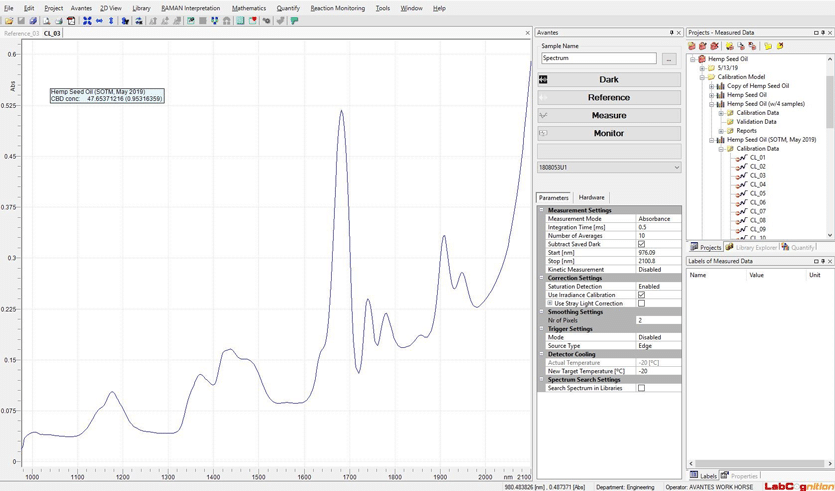
Fig. 7
Our second test with a different CBD oil predicted a concentration of 47.66 mg/mL. This batch contained 47.69 mg/mL concentration of CBD.
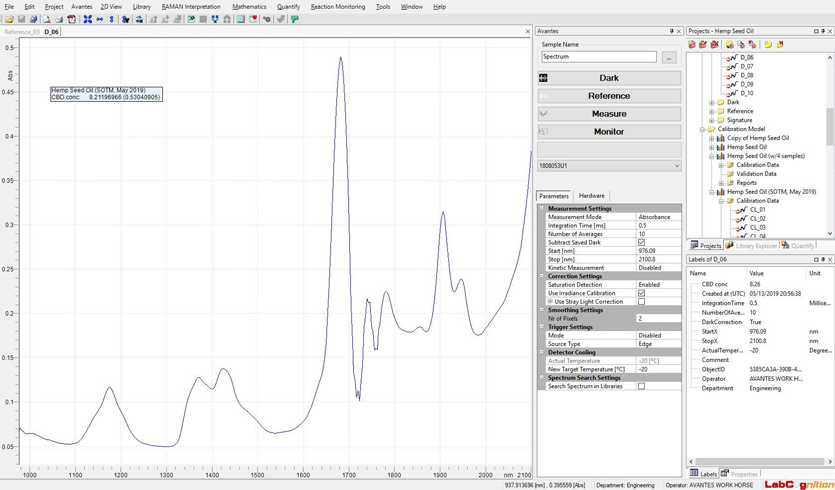
Fig. 8
With our third sample, CBD concentration was predicted to be at 8.21 mg/mL. The actual concentration was 8.26 mg/mL.
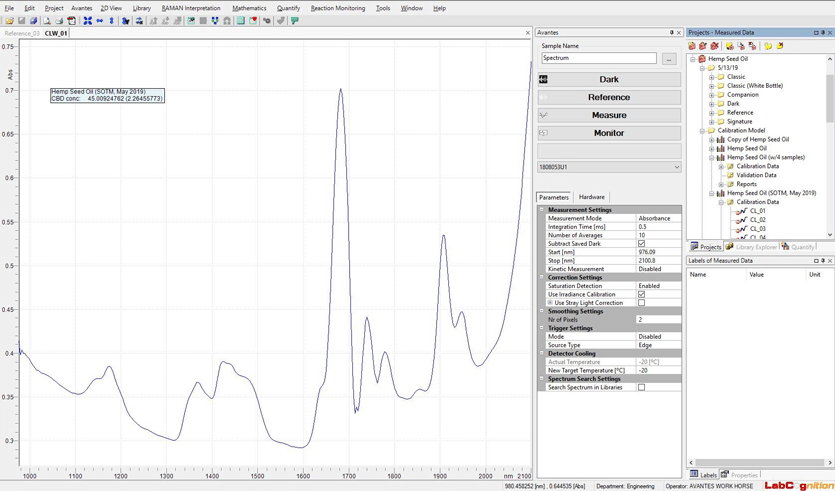
Fig. 9
Our fourth and final sample was predicted to have a concentration of 45.01 mg/mL, with an actual concentration of 45.10 mg/mL.
Conclusion
In conclusion, the AvaSpec-NIR512-2.5-HSC high sensitivity, low noise NIR spectrometer combined with the powerful capabilities of Panorama, can produce a highly accurate model capable of predicting the concentration of CDB in various samples. In order to further improve this model, additional samples can be added to the calibration. This model development could be applied to a variety of nutraceuticals products in liquid or powder form with the caveat that sample homogeneity is critical to success with these types of samples.
Connect with an Expert
To learn more about this application experiment or to test drive a system today
 My Cart
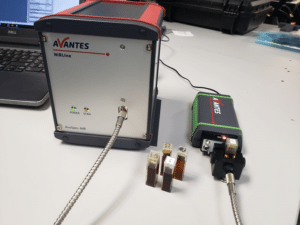

