 My Cart
 Measuring the Chlorophyll in Poinsettias with Fluorescence Spectroscopy
Background/Applications:
Chlorophyll is the essential pigment that allows plants to absorb energy from light. It absorbs light most strongly in the blue and red portions of the visible spectrum and weakest in the green portions of the spectrum, which gives it its recognizable green color. Detection of chlorophyll dates back to the early 19th century when it was isolated by Joseph Caventou and Pierre Pelletier in 1817. Later studies detected the elemental composition and general structure of the molecule, using methods such as stereochemistry, nuclear magnetic resonance, and optical and mass spectra. To determine chlorophyll concentrations, one method that can be used is ratio fluorescence emission. Chlorophyll has a detectable fluorescence from 650-800 nm (Pedrós et al., 2008)1, and by taking a ratio of fluorescence emission peaks at around 735 nm and 700 nm, a linear relationship for chlorophyll content can be derived, but the real question is how long does it take for chlorophyll to work?
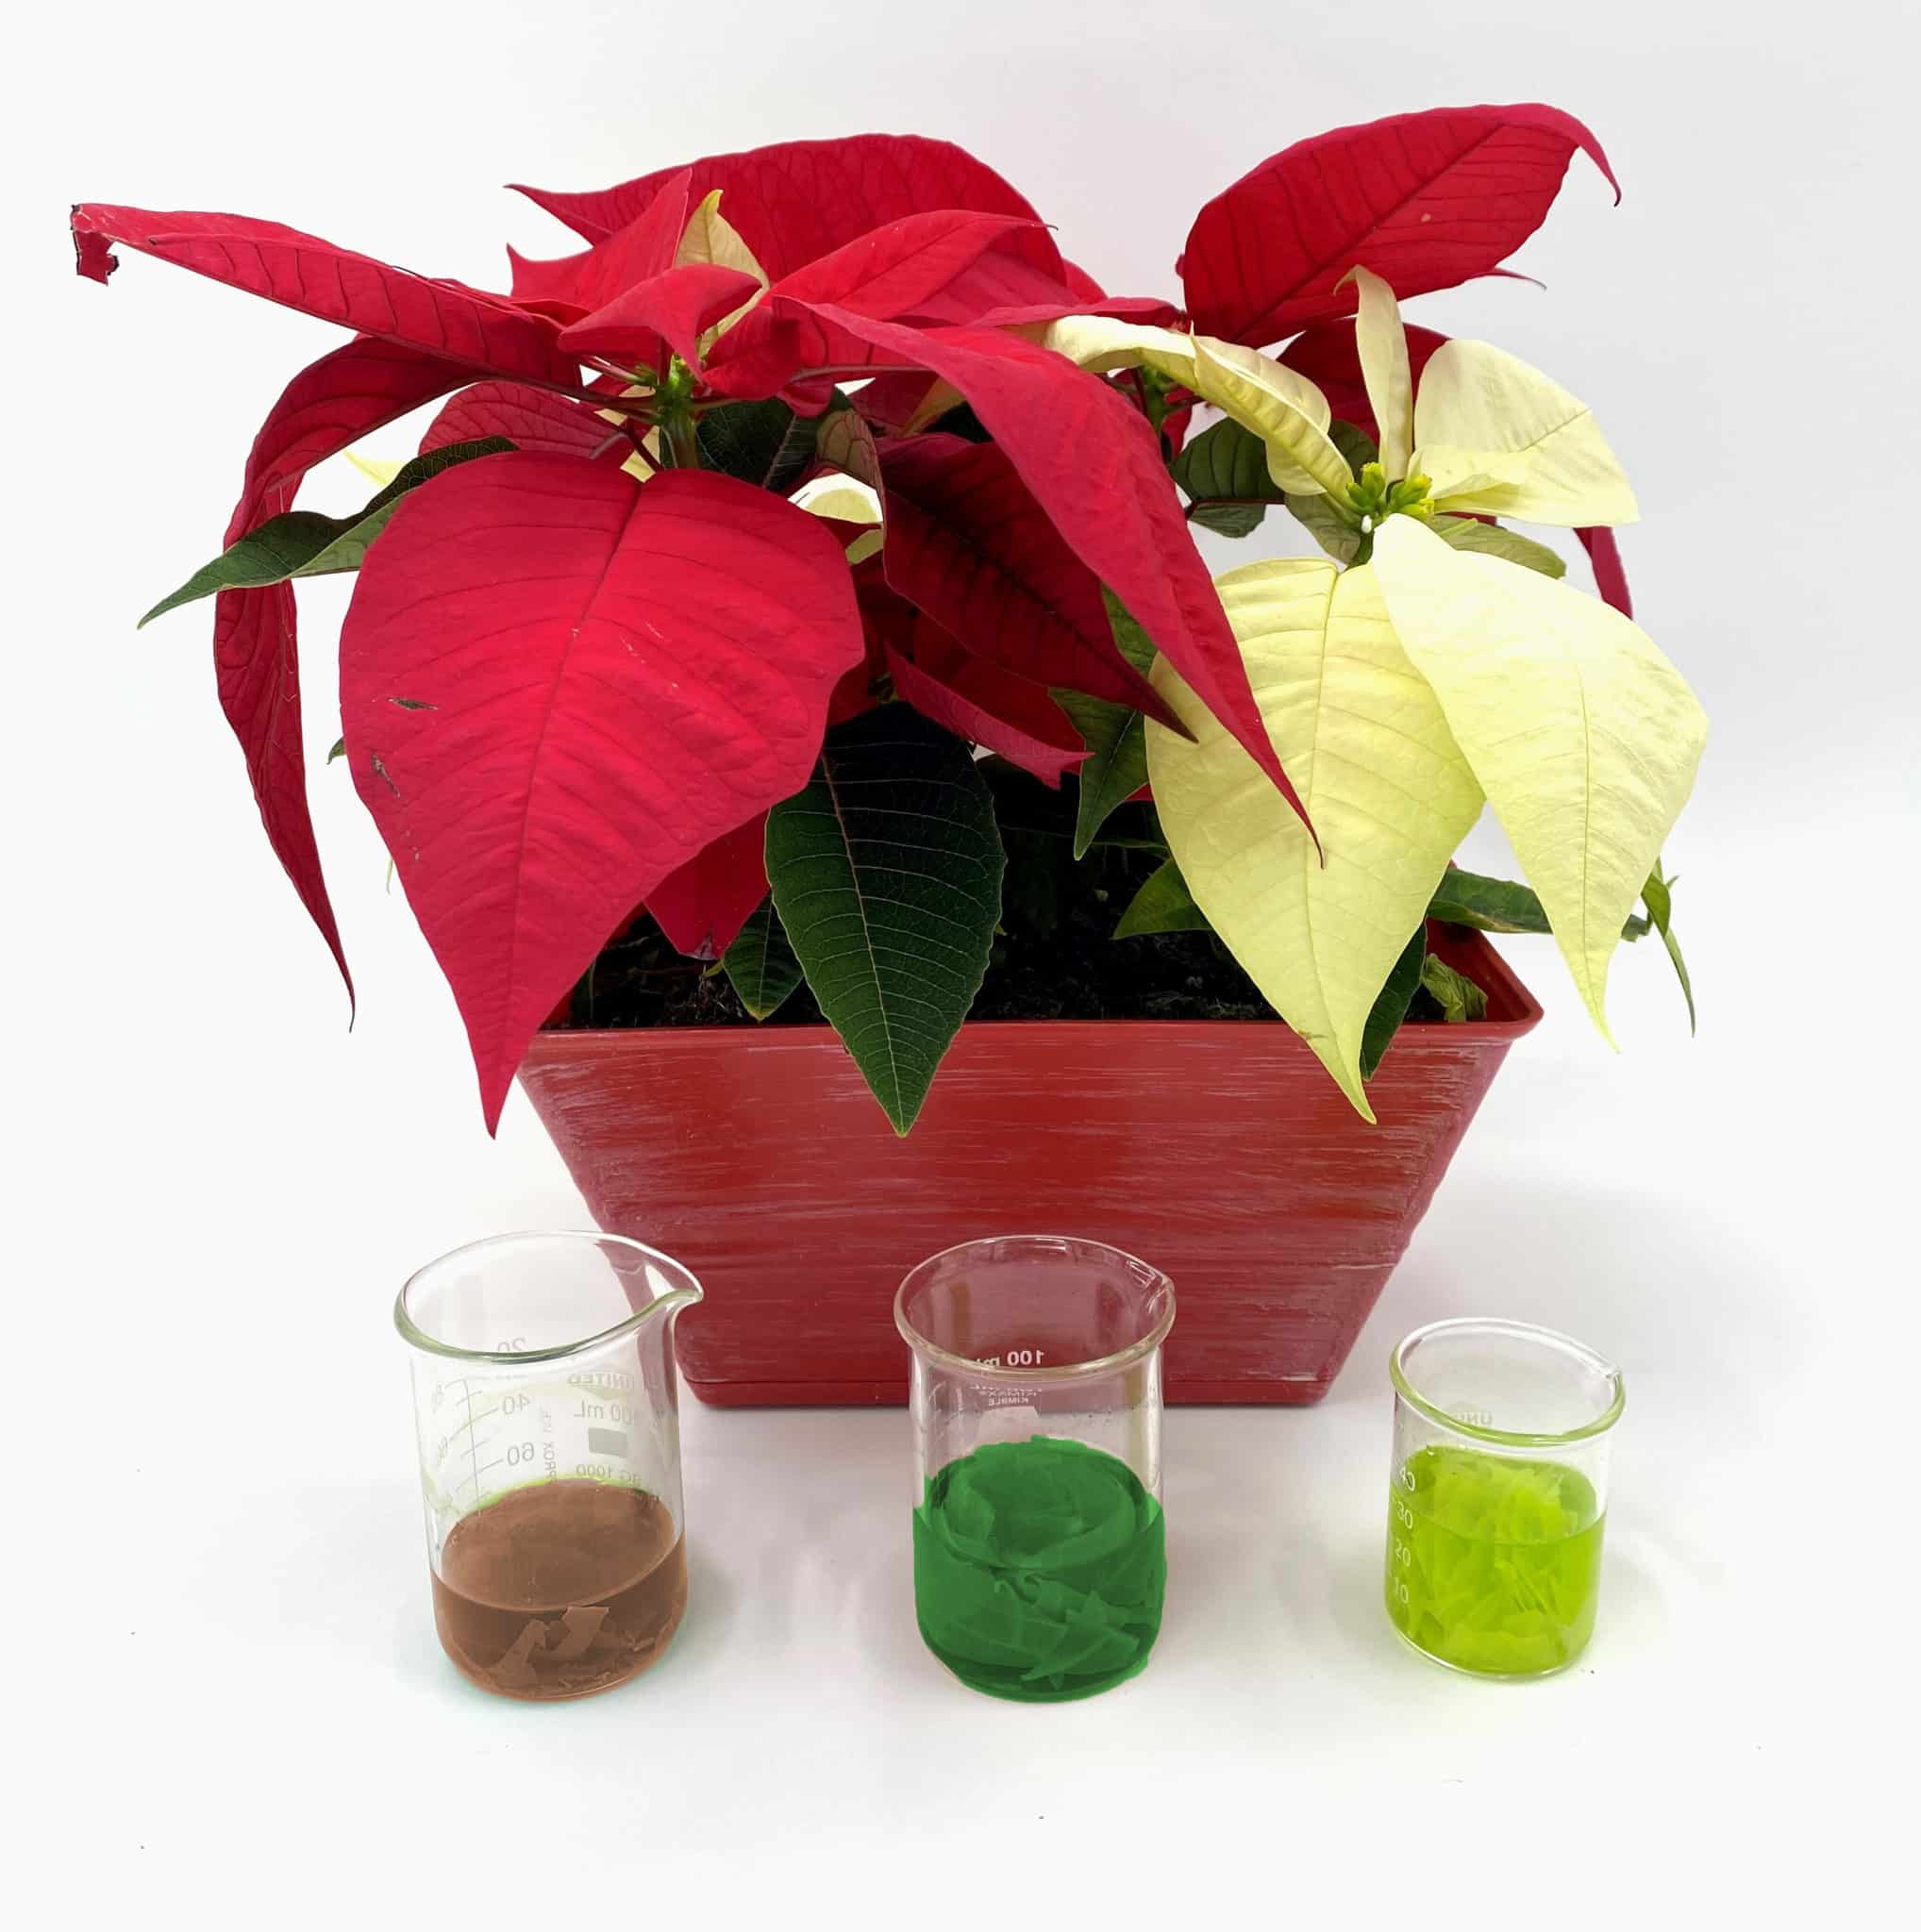
Figure 1: Poinsettia plant used for the experiment with samples of red (left), green (middle), and white (right) leaves dissolved in methanol.
This experiment aims to measure chlorophyll concentration in poinsettias leaves of different colors, including red, green, and white, through a comparison of their respective fluorescence spectra. The choice of poinsettias is due to their popularity during the Christmas holiday. It is known that the presence of chlorophyll is what gives plants their green hue, and a lack of chlorophyll results in leaves with a redder to yellow color. With this in mind, we expect to see higher chlorophyll concentration in the green poinsettia leaves compared to the red ones via a higher fluorescence emission peak. We will also measure a white poinsettia leaf sample to determine how it compares to the red and green leaf samples in terms of chlorophyll concentration. Each leaf was dissolved in methanol in order to isolate and extract the chlorophyll from each sample (Figure 1).
Description of System:
The setup for this experiment (Figure 2) was based around the AvaSpec-ULS2048CL-EVO. This device has the latest technology in spectroscopy, which ensures the platform for years to come. This instrument offers USB3.0 communication, which has ten times the speed of USB2, a CMOS detector, a fast AS-7010 microprocessor, and 50 times more memory capacity, meaning more spectra can be stored onboard and more overall functionality can be realized. Furthermore, this spectrometer can be customized with a wide range of slit sizes, gratings, and fiber optic entrance connectors for a variety of application needs.
The light source used for this experiment was the AvaLight-Hal-S-Mini, a compact, stabilized halogen light source. Designed to work from visible light to near-infrared, the AvaLight-Hal-S-Mini is equipped with an adjustable focusing on the fiber connection to maximize output power at desired wavelengths and has a filter slot mounted on the front that accepts 1” round or 2”x2” square filters to block specific ranges of wavelengths or instantly lower the intensity. In addition, the electrical power output of the light source can be adjusted to either provide extra power or longer bulb life.
Other accessories used for this experiment included a monochromator, which is used to filter a broad light source to a specific wavelength to ensure only the emission spectrum was observed, a direct attach cuvette holder (CUV-DA) to expose the samples to the maximum amount of light, a cuvette holder cover (CUV-COVER-DA) to minimize the effects of ambient light on the emission spectrum, and a 600-micron core fiber optic cable (FC-UVIR600-1-BX) to connect the cuvette holder to the spectrometer. All three samples (red leaf sample, green leaf sample, and white leaf sample) were contained in four-window cuvettes when measured.
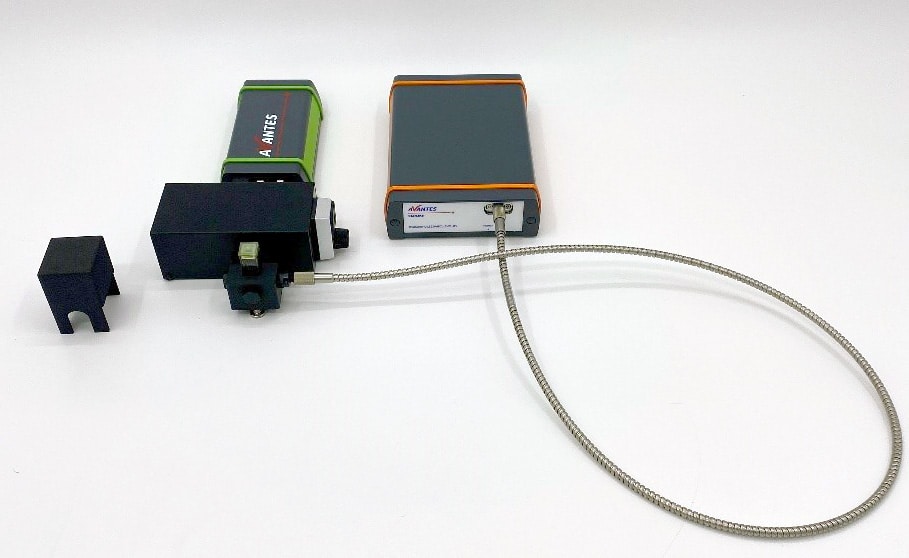
Figure 2: Experimental setup for chlorophyll measurement. For the actual measurements, the samples were covered to minimize the effects of ambient light but are not covered here for clarity of measurement technique.
Description of Methodology:
Each leaf sample was dissolved in approximately 30 mL of methanol. Each suspension was then heated on a hot plate at 120°C for one minute to extract the chlorophyll from the leaf samples. The chlorophyll-methanol mixture was pipetted into four-window cuvettes for analysis. The monochromator was directly attached to the AvaLight-Hal-S-Mini and cycled through wavelengths until the maximum magnitude for the samples was found. The optimum excitation wavelength was found to be 620 nm.
For data analysis, we used the scope-minus-dark mode in AvaSoft, our exclusive custom software package. This is a common mode for measuring fluorescence as it subtracts the dark spectrum (what the spectrometer measures with no light source) from the raw counts (i.e., scope mode) for each wavelength. This helps minimize noise in the spectrum and better isolate the emission peaks, which can be especially useful when low signal is a limitation, as can often be the case in fluorescence measurements. We used an integration time of 9 seconds, which can be adjusted to increase or decrease the amount of light being measured at one time and affects the overall magnitude of the reported spectrum. We set averaging to 2, meaning two values were averaged together to provide more consistent spectra results. While not pictured in the setup, we covered all samples with a cuvette holder cover to ensure the only light measured was from the light source and did not include ambient light effects.
Test Data and Results:
Displayed below are the fluorescence spectra of the samples.


Analysis:
The fluorescence spectrum for the red poinsettia leaf sample had measured emission peaks at 673.90 nm and 722.84 nm (Figure 3). This corresponds well to the reported emission peak for chlorophyll, which ranges from 650-800 nm (Pedrós et al., 2008). The fluorescence spectrum for the green poinsettia leaf sample showed substantially higher emission peaks at 687.17 nm and 730.87 nm (Figure 4). Both peaks are shifted slightly higher compared to the red leaf sample but are still consistent with the reported emission peak for chlorophyll. The fluorescence of the white poinsettia leaf sample (Figure 5) gave similar emission peaks (675.63 nm and 726.28 nm) as the red leaf sample, but a larger magnitude at each emission peak.
A plot of all three spectra is also provided to illustrate this difference in peak intensity (Figure 6). To directly compare the chlorophyll content of each sample, the ratio between the peaks at around 735 nm and 700 nm was taken. For the red leaf sample, the ratio between the two peaks was 7492.67/26998.33 counts, which was equal to 0.278. For the green leaf sample, the ratio was 44973.55/53473.00 counts, or 0.841. The white leaf sample had a ratio of 13650.20/44659.54 counts, or 0.306. This demonstrated how much higher the chlorophyll concentration in the green leaf sample is compared to the red and white leaf samples. It also showed that the red and white leaf samples had similar chlorophyll concentrations despite how much greener the white leaf sample appeared compared to the red leaf sample.
Conclusion:
In conclusion, the present experiment highlights the differences in chlorophyll concentration in different colored poinsettia leaves through comparison of fluorescence spectra. The AvaSpec-ULS2048CL-EVO is well suited for a variety of uses thanks to its versatility and wide range of configurations and is future proof for duplicating the experiment for years to come. In addition to the spectrometer, the AvaLight-Hal-S-Mini is an equally versatile light source that can be used for a wide range of applications, including fluorescence. Please contact Avantes for more information on the configuration that is best suited for your data collection.
References
Pedrós, R., et al, 2008. Chlorophyll fluorescence emission spectrum inside a leaf. Photochemical & Photobiological Sciences 7:498-502. https://doi.org/10.1039/b719506k