 My Cart
 Indocyanine Green Fluorescence Using Raman Laser Spectroscopy
Conducted by: David Ademe (Applications Engineer), and Sara Beard (Chemistry Intern), Avantes Inc.
Background/Applications:
Indocyanine Green (ICG) is a powdered dye that is used for fluorescence imaging in a variety of medical applications. Indocyanine green emits fluorescence between 750 nm and 950 nm with maximum values of approximately 810 nm when dissolved in water. Compared to other fluorescence imaging dyes, such as Fluorescein, ICG provides imaging in the Near-Infrared (NIR) wavelength range from 780 nm to 2500 nm. The NIR range offers deeper imaging that operates in the tissue optical window. The tissue optical window ranges from 650 nm to 1350 nm which is the range where light has a maximum depth to penetrate tissue.
For medical applications, ICG powder is dissolved in sterile water which prepares the solution for injection. The injection solutions are highly concentrated but differ based on the particular application. Some of the uses for ICG consist of hepatic function studies (preparative tests for major liver surgery), ophthalmic angiograms (tests on blood vessels and other structures in the back of the eye), and lymphatic mapping (lymph nodes, lymphatic vessels, and lymphatic fluid).
The ICG injection solution is paired with an infrared laparoscope in surgical applications. The fluorescence light passes through the laparoscope’s optical filter, allowing surgeons to work in two different infrared modes. The first IR mode detects detailed structures under infrared light. The second IR mode shows the pure fluorescence made with the highest contrast in a black-and-white image. The ICG absorbs the infrared radiation from the light source and emits longer wavelengths of infrared radiation, which makes ICG detectable in the human body.
In this experiment, ICG concentrations were made in the range of 2 to 50 micromolar. A micromolar is a concentration of one-millionth molecular weight per liter. This range allows light to still pass through the solution without being fully absorbed. If tests were conducted with the surgical application concentrations, the deep, dark green color of the ICG would absorb most if not all of the light. Usually, the more concentrated a dye, the more fluorescence it will emit (like in Fluorescein). However, a highly concentrated solution of ICG is almost black in color making it optical opaque and not suitable for a fluorescence reading. Upon observing this, we contacted Dr. John Black, a chair for IEEE Engineering in Medicine and Biology Society, and he recommended the useful range of 2 to 50 micromolar.
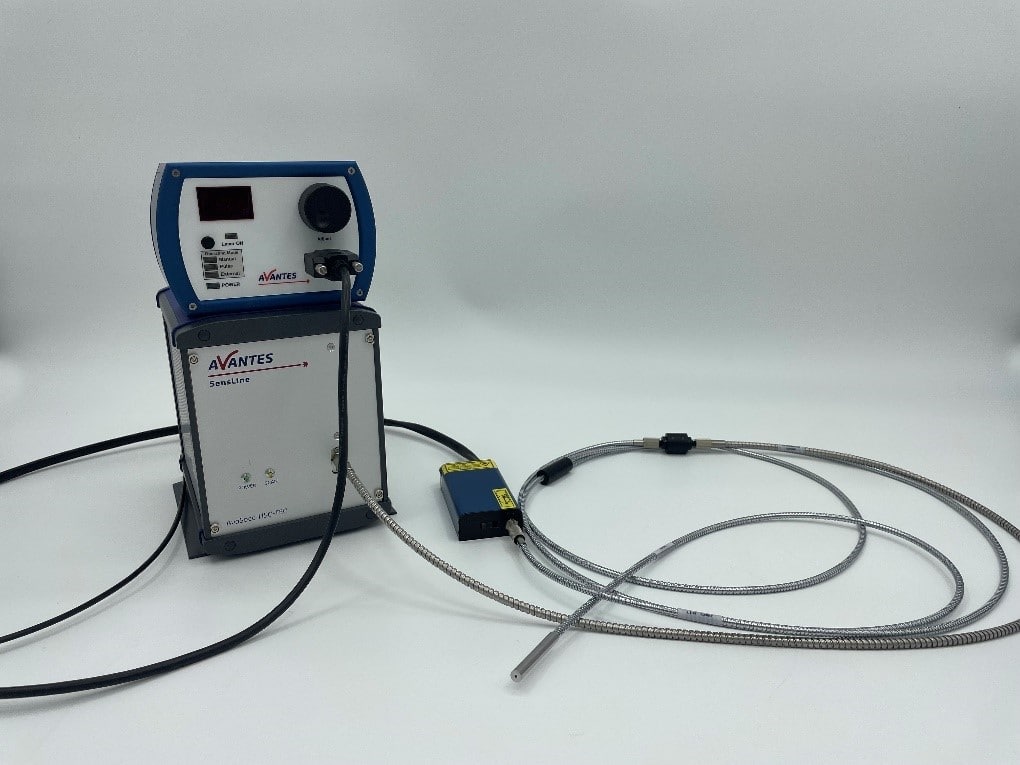
Figure 1. Setup of Fluorescent Test
Description of System:
For this experiment, we used the AvaSpec-HERO spectrometer. The AvaSpec-HERO is built up around our High-Sensitivity, Compact (HSC), 100mm optical bench offering a NA of 0.13 and a cooled, back-thinned detector (1024×58 pixels). Electronics-wise, it uses our latest AS7010 board, which includes a high-performance Analog to Digital converter with excellent signal-to-noise performance and the ability to facilitate high-speed communication through USB 3.0 and Ethernet. Due to the high sensitivity and signal-to-noise of this instrument, the HERO is ideal for fluorescence measurements.
To excite the sample, a 785 nm Raman laser was used. This laser was attached in line to a reflection probe. On the receiving end of the reflection probe, a long pass filter was used to block the 785 nm laser from being seen by the spectrometer (Figure 1). This ensured that only the fluorescence emission peak was observed by the user.
Description of Methodology:
The first step taken in this experiment was determining the proper solution concentrations. As mentioned above, the range that would be best to test the fluorescence of ICG was recommended to be 2 to 50 micromolar. In the first tests that we ran before consulting with Dr. John Black, we used surgical concentrations of 1.25 mg/mL, 5 mg/mL, and 20 mg/mL. These concentrations corresponded to different medical applications respectively. The injection solution of 1.25 mg/mL is used for lymphatic mapping, the injection solution of 5 mg/mL is for hepatic function studies, and the injection solution of 20 mg/mL is used for ophthalmic angiograms. After running a couple of tests using these concentrations, we realized that the solutions were too dark in color for proper fluorescence readings. Although these concentrations are used in surgical procedures with laparoscopic equipment and receive proper readings, the higher concentrated solutions have a different host material than what we were experimenting with. ICG responds differently to respective host materials.
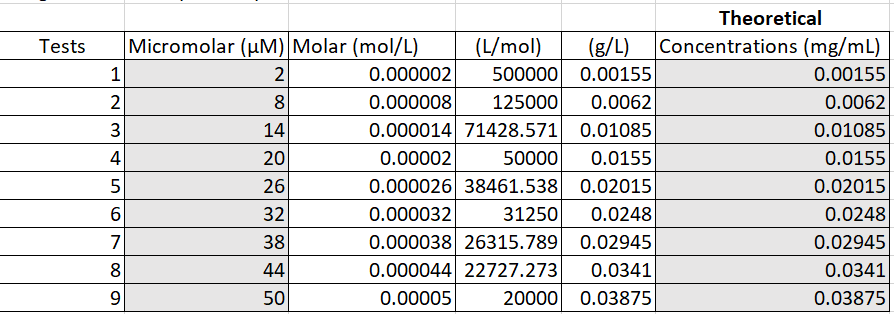
Figure 2. Converting micromolar to mg per mL
In this experiment, we used distilled water as our solvent. To get the proper concentrations in the micromolar range, we converted the micromolar values to mg per mL. We evenly split up nine groups among the range and found the theoretical concentrations in mg/mL using dimensional analysis and Excel (Figure 2). To be able to carry out the theoretical concentrations, base concentrations were made of the ICG and the distilled water (Figure 3).
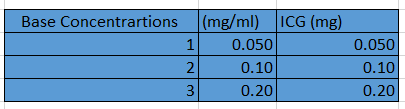
Figure 3. Base concentrations of ICG in distilled water
The base concentrations were then diluted with more distilled water to get the concentrations that were needed in the proper range (Figure 4). The highlighted yellow values used the first base concentration of 0.050 (mg/mL), the highlighted light green used the second base concentration of 0.10 (mg/mL), and the highlighted dark green values used the third base concentration of 0.20 (mg/mL). One milliliter of base concentration was added to the highlighted values to get the wanted concentration. More calculations were then run to find the actual concentrations based on the amount of sensitivity we have with our measuring and weighing equipment. The actual concentrations were then converted back to micromolar to see a more accurate range of the concentrations made (Figure 4). The final nine concentrations can be seen in Figure 5.
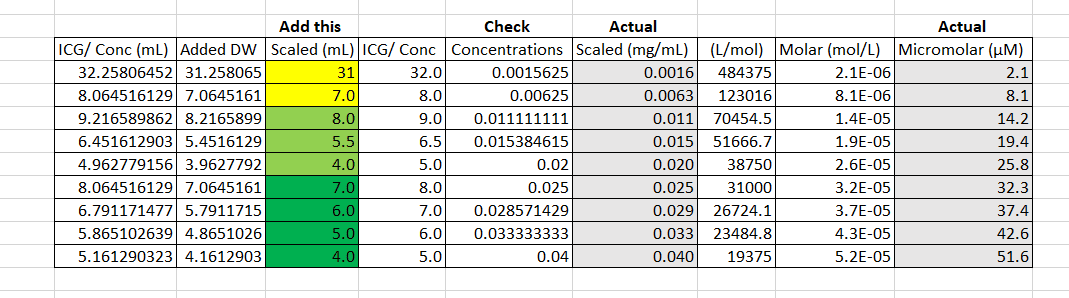
Figure 4. Calculations of actual concentrations and micromolar range from theoretical values
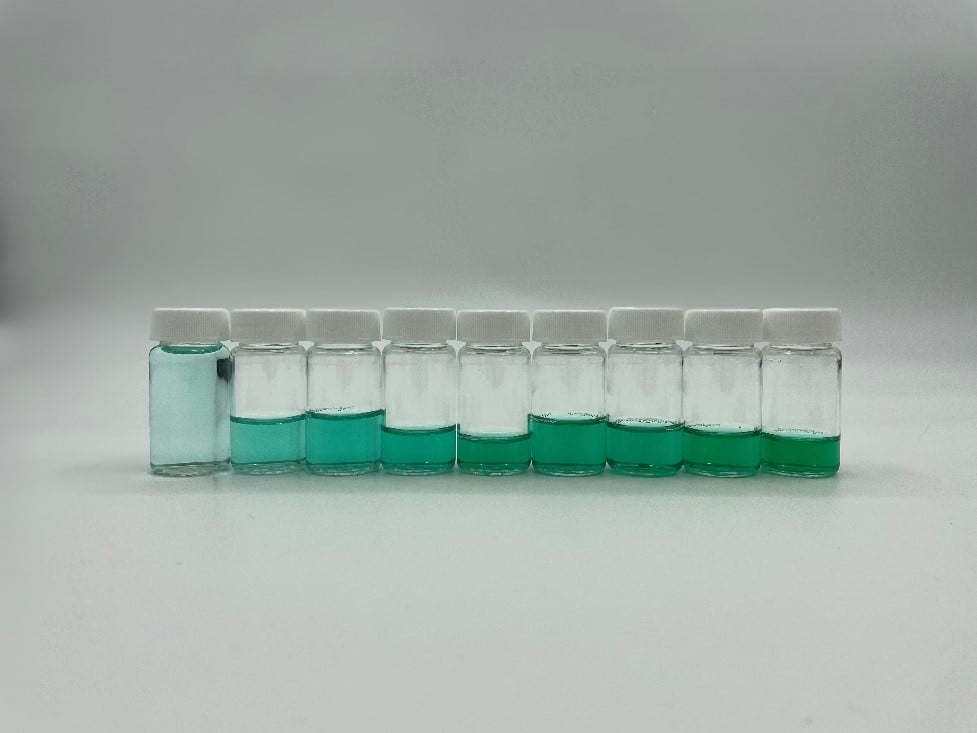
Figure 5. Different concentrations of ICG with distilled water
When the samples were ready to be tested, we first ran the experiment in a fully lit room. We soon realized that the equipment was picking up the ambient light in the room due to the low concentrated solutions. We then moved the equipment and ran the tests in a blackout room. The spectra no longer had the ambient light influences so the fluorescence of ICG could be analyzed.
We measured the spectra from the samples by submerging the reflectance probe in each vial. The probe was held steady for around thirty seconds or until a solid reading was received. The integration time was for three seconds with an averaging of two. In between each concentration sample reading, the reflection probe was cleaned with distilled water and wiped down.
Test Data and Results:
Figures 6-15 show the experimental results from the ICG fluorescence measurements. For this experiment’s raw scope, A/D counts from the spectrometer are used rather than calibrated fluorescence counts coming from a radiometric calibration of the spectrometer’s sensitivity. A possible future variant of this experiment would include re-measurement with a radiometrically calibrated spectrometer.
")
")
")
")
")
")
")
")
")

Analysis:
From the spectra received, the trend of fluorescence peaks shows that the more concentrated samples had shallower fluorescence spectrums overall but had higher max peaks. For example, sample 1 (Figure 6) had a concentration of 0.0016 mg/mL with the largest spectrum and had a max peak of 812.93 nm. Sample 2 (Figure 7) had a concentration of 0.0063 mg/mL with the second-largest spectrum and had a max peak of 815.68 nm. This pattern continued fairly consistently with all of the samples. ICG emits fluorescence between 750 nm and 950 nm with maximum values of approximately 810 nm when dissolved in water. The sample’s maximum peak values ranged from 812.93 nm to 823.94 nm. The spectra obtained matched the literature describing fluorescence emission.
Usually the more concentrated a dye, the more fluorescence it emits. However, in this case, ICG does the exact opposite. ICG has special properties that could be the cause of this. For starters, ICG has a close excitation and emission spectra that often leads to the excitation light being detected together with the emission signal. ICG has an excitation emission at around 790 nm. The overlap of spectra exhibits concentration-dependent fluorescence quenching. Quenching refers to any process that lowers the fluorescence intensity of a given substance or solution. Excited-state reactions, energy transfer, and formational collisions can all result in quenching. Dr. John Black, with the Medicine and Biology Society, described this phenomenon by further adding that ICG’s molecules are close enough together that they self-absorb the fluorescence photons and convert this energy into vibration (heat) by some internal conversion mechanism.
The explanation of the ICG fluorescence trend is not completely known. ICG has been notorious for receiving interesting and non-linear readings. The chemical and spectropic properties of ICG can cause quenching of solutions. However, in medical applications, the same trend does not always follow. ICG when injected into a human body responds very differently than when tested with distilled water with no other host material. In some applications, ICG cannot be read at any concentration. Some of the host materials with the best medical implant properties cannot read the ICG. Similar to when we ran the ICG solutions with the higher concentrations, some host materials create an almost black coloring that absorbs all the light and does not allow for a proper reading.
Conclusion:
Indocyanine Green and fluorescence imaging testing is beneficial to many medical applications. The powdered green dye reaches the Near-Infrared range (NIR) which offers deeper imaging that operates in the tissue optical window. ICG is non-toxic, inexpensive, and fairly easy to use in medical applications. It is a great asset to fluorescence testing and is currently the most popular imaging mode.
With all of this said, ICG still remains to be tested and tried. A lot of its properties, especially pertaining to fluorescence, is unknown and cannot be explained in full. After conducting this experiment, we validated some key factors of ICG fluorescence testing. The first is that the concentration of the ICG is important. Based on the solvent and or host material, the concentration needs to be calculated correctly or the instrumentation will not be able to read the spectra. The second is that the setup of the system needs to block out the excitation-emission. In this experiment, we used a 785 nm Raman laser light source and a long pass filter to make sure that the excitation-emission did not overly interfere with the fluorescence emission. Lastly, with the low concentration samples, a darkroom was required for testing so that ambient light would not be picked up by the reflectance probe.