 My Cart
 Fluorescence of Green and Blue Proteins
Measuring the Fluorescence of Green and Blue Proteins in Algae:
Bioluminescence from marine microorganisms has been observed by many people at various beaches across the world. A bright bursting energy of light is observed when energy is transferred to the fluorescent protein (GFP). One example of this is in Aquorea Victoria, a bioluminescent jellyfish. The GFP in the Aquorea Victoria is located in a specialized photogenic cell located in the base of the jellyfish umbrella. There are several variants to GFP protein that have been genetically engineered, such as the blue fluorescent protein (BFP).
The GFP from Aquorea Victoria has a major excitation peak at a wavelength of 395 nm and a minor one at 475 nm. Its emission peak is at 509 nm, which is in the lower green portion of the visible spectrum. The GFP from the sea pansy (Renilla reniformis) has a single major excitation peak at 498 nm.
Our goal will be to analyze the fluorescence of green and blue proteins peaks that are present in the GFP fluorescence spectrum to see if we can determine which marine specimen the protein may be from. We will also test the BFP to see what identifying peaks are visible.
Conducted by: David Ademe, Avantes Inc.
Description of Fluorescence Measurement System

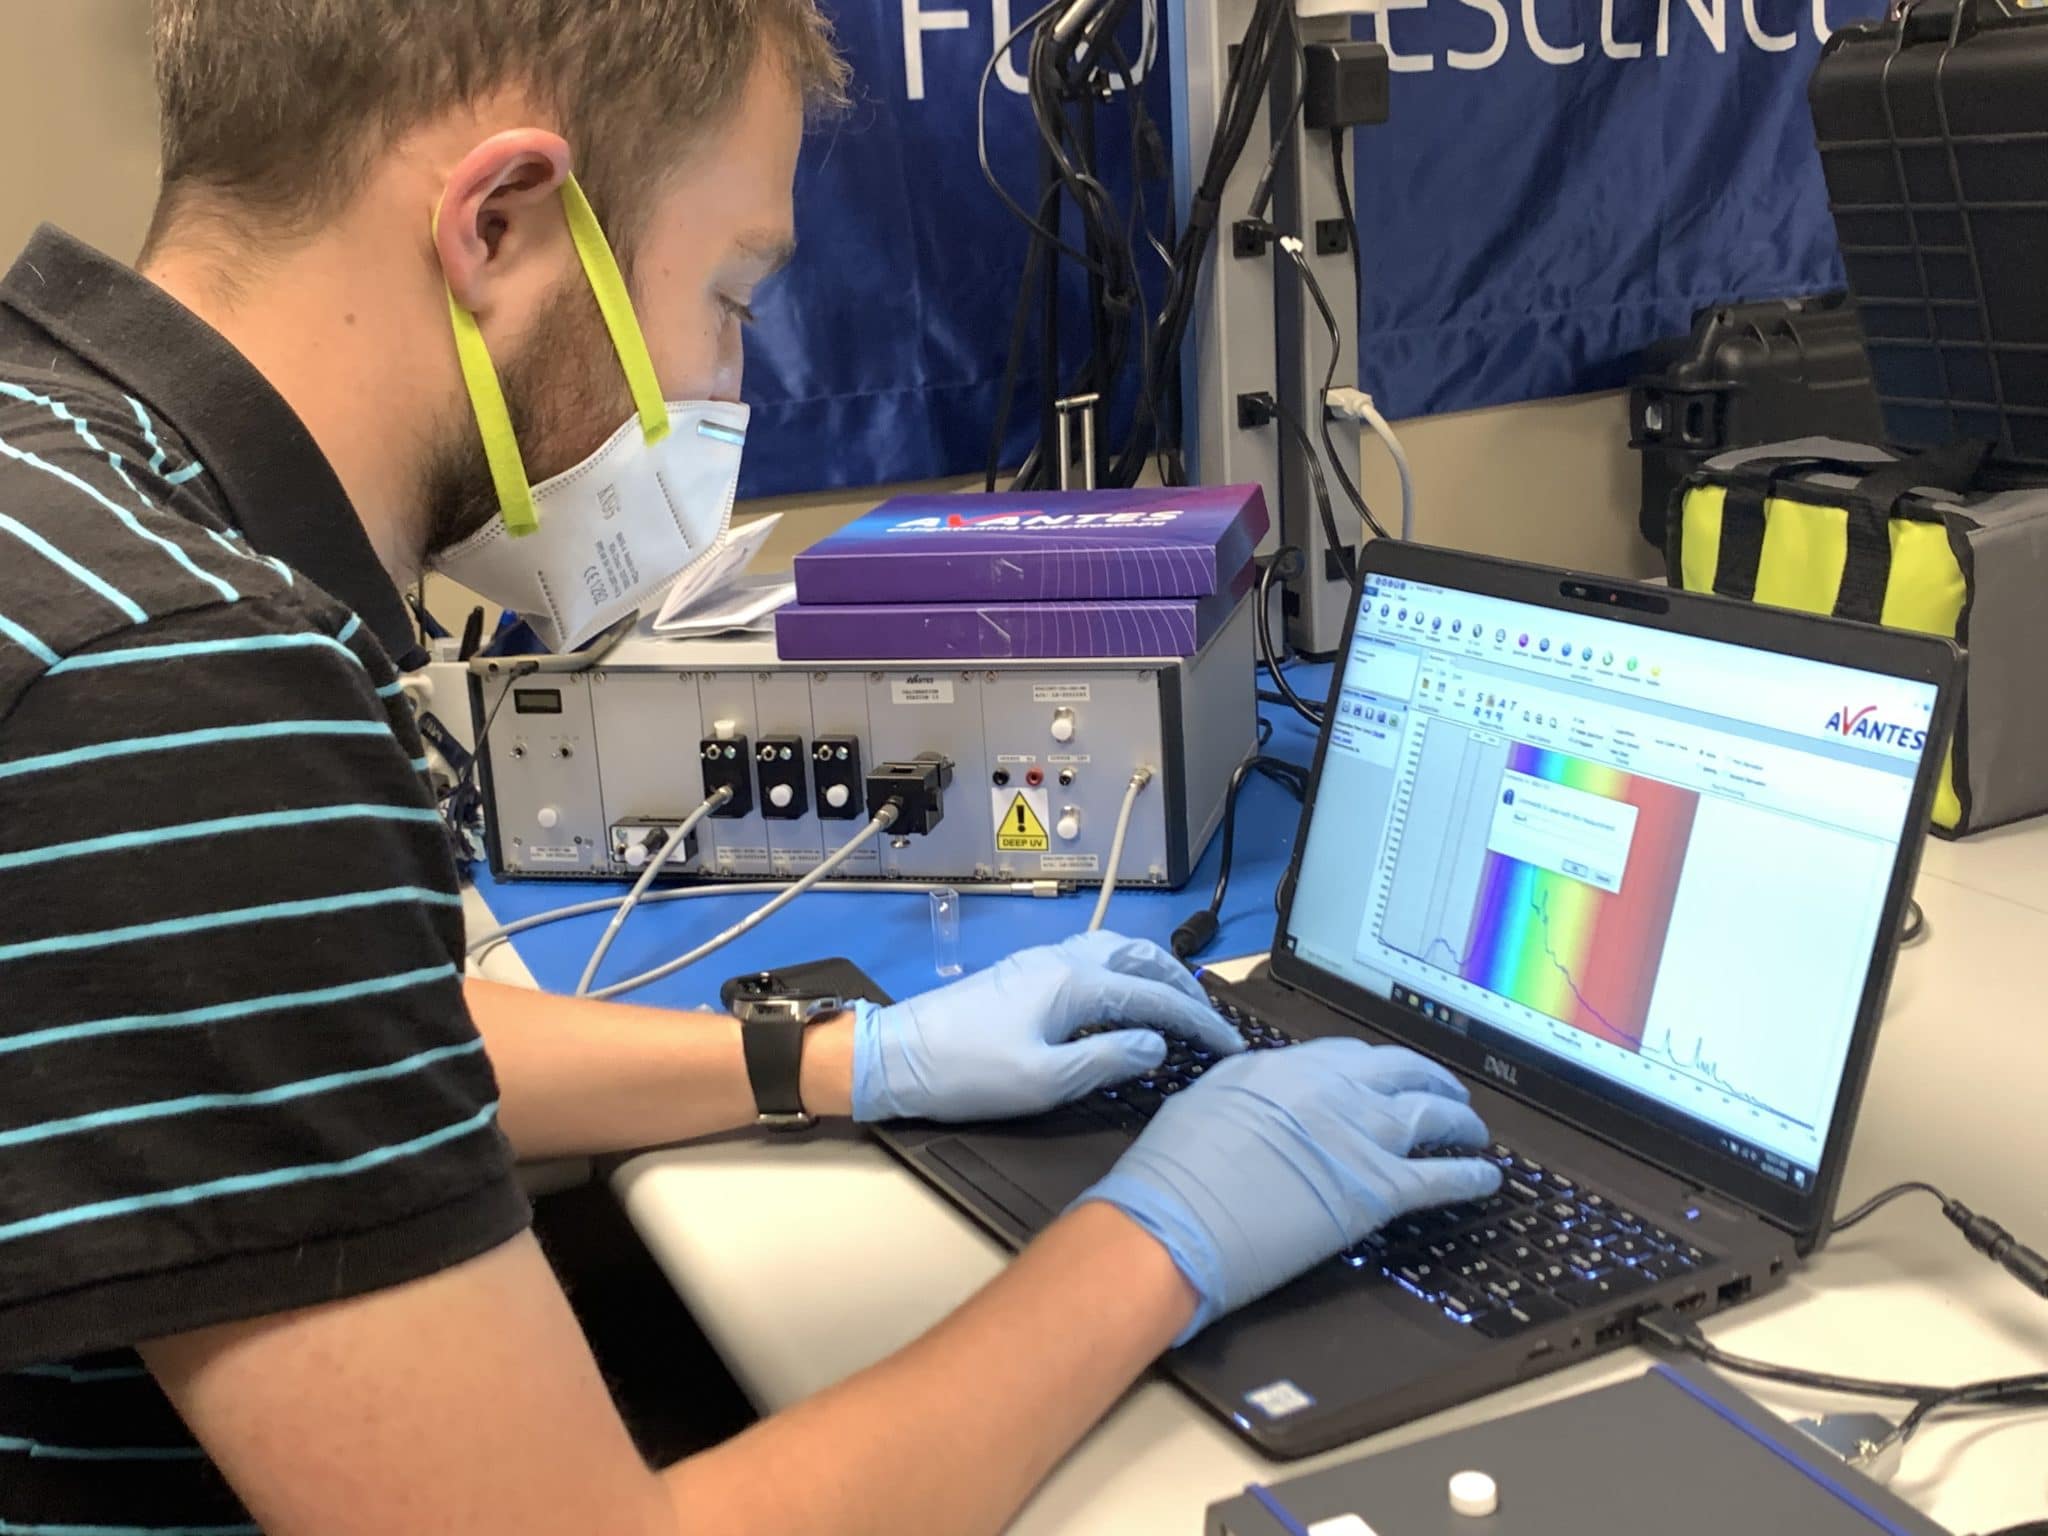
Figure 1: The setup of the experiment.
For this experiment, we will be using a pulsed xenon light source as the AvaLight-XE-Mini provides a high-intensity spectral output across the UV/VIS range. Xenon is an excellent light source to use for fluorescence measurements due to its intensity. In many fluorescence applications, it can be challenging to capture the fluorescence signal due to its usual low intensity. A xenon source makes the spectrum much easier for the receiving fiber to collect.
We will be using a direct attach cuvette holder attached to the front of the light source to ensure that as much light is hitting the sample as possible. The fluorescence signal will be picked up by a fiber bundle which will then feed the light into the spectrometer. For this experiment, we will be using the AvaSpec-ULS2048XL-EVO.
Combining exceptional quantum efficiency with high-speed communication is the value proposition of the AvaSpec-ULS2048XL EVO spectrometer. Unlike many back-thinned CCD spectrometers that have two-dimensional arrays, the ULS2048XL-EVO has large monolithic pixels of 14×500 microns with exceptional efficiency in the UV range, from 200 to 400 nm, and the NIR range, from 950 to 1160 nm. The instrument also has an electronic shutter, which enables integration times as low as 2 microseconds. To further enhance sensitivity, a detector collection lens is available, which improves sensitivity up to 60% when combined with larger core fibers. The configuration used in this experiment is configured for a range of 200 nm to 1160 nm, allowing us to have a broad look at the fluorescence spectrum of GFP and BFP.
Description of Methodology
For this experiment, we used the scope mode in AvaSoft. This is the most common mode for measuring fluorescence.
Test Data and Results
Displayed below is the fluorescence spectra of the samples.
Integration time: 750 ms
Averaging: 10


Analysis
 The GFP displays a very strong emission peak at 509 nm, which is a characteristic of the Aquorea Victoria. This allows us to assume Aquorea Victoria is the source of our GFP sample. The BFP exhibits a maximum fluorescence intensity from 379 nm to 500 nm, which matches the expected maximum fluorescence range of BFP. Specifically, the peak at 457 nm is the most identifiable peak in BFP.
Next steps in testing would include using the Avantes fluorimeter kit, using the monochromator to dial in the exact major excitation wavelength of 395 nm and minor excitation wavelength of 475 nm to create the 509 nm emission peak of GFP.
Conclusion
In conclusion, the AvaSpec-ULS2048XL-EVO is well suited for a wide range of applications that require high sensitivity, such as fluorescence and other low light applications. This spectrometer can easily be configured to fit your specific application just as it is needed. Please contact Avantes for more information on the configuration that is best suited for your data collection.
Get the Downloadable Data Files
Looking for Fluorescence Solutions?
Speak with our knowledgeable sales engineers about your application now.