Fluorescence Spectroscopy of Tryptophan in Turkey and Milk
Background/Applications:
Fluorescence spectroscopy can be used in a wide range of applications from medical, to fraud detection, and food safety. For example, in medical applications, fluorescence is being used to distinguish between healthy and cancerous tissues. In the realm of fraud and counterfeit detection, fluorescent markers are being implanted in products ranging from fuel to pharmaceuticals and even bank notes which can be measured at high speed to verify authenticity. Furthermore, fluorescence may be used in food safety techniques to detect pathogens due to their distinctive fluorescent fingerprint.
Food scientists may also use fluorescence to characterize meat and dairy products to detect constituent amino acids. One such well-recognized amino acid found in dairy, fish, poultry, and other foods is L-Tryptophan, which has a detectable fluorescence from 300-400 nm. L-Tryptophan is one of 20 naturally occurring amino acids and has a peak excitation wavelength of around 280 nm and emits fluorescence from 300-400 nm. Tryptophan along with Tyrosine and Phenylalanine are intrinsically optically active because they are conjugated with aromatic ring side chains.
Description of Experiment
This experiment aims to measure tryptophan in both turkey meat and whole milk and then compare it to tryptophan in a solution. The choice of turkey meat is related to the US Thanksgiving holiday, during which many households consume turkey. A common belief is that Tryptophan is attributed to lethargy and tiredness after the Thanksgiving meal. Because this is not scientifically correct, we are able to demonstrate that whole milk actually has higher levels of L-Tryptophan than turkey, effectively dispelling this myth.
Description of System:
The setup for this experiment (Figure 1) was based around the AvaSpec-ULS2048CL-EVO spectrometer. This instrument has the latest technology in spectroscopy, which ensures the platform for years to come. It is a versatile instrument that offers USB3.0 communication, which has ten times the speed of USB2, a fast microprocessor, and 50 times more memory capacity, meaning more spectra can be stored onboard and more overall functionality can be realized. Additionally, it can be customized with a wide range of slit sizes, gratings, and fiber optic entrance connectors for a variety of application needs.

Figure 1: Experimental setup for (A) diluted tryptophan measurement, (B) turkey meat measurement, and (C) whole milk measurement. For the actual measurements, the samples were covered to minimize the effects of ambient light but are not covered here for clarity of measurement technique.
The light source used for this experiment was the AvaLight-HPLED-285, a compact, affordable LED light source with a peak wavelength of 285 nm. Designed for fluorescence applications, this high-power version was made for more demanding applications compared to our regular LED light source. The AvaLight-HPLED light sources produce continuous output or pulsed spectral output at different wavelengths via a programmable Pulse Width Modulation (PWM), supplied by an AvaSpec-USB2 or EVO spectrometer (IC-DB26-2 cable needed). All sources have an SMA-905 connector to connect fiber optics to the device and come with a 5V/1.6A power supply.
Other accessories used for this experiment included a specially designed reflection probe with a 45-degree window tip that illuminated the sample and collected measurements of the indirect reflections, a filter holder containing a 305 nm long-pass filter to ensure only the emission spectrum was observed, and a fiber optic cable to connect the filter holder to the spectrometer. All three samples (diluted tryptophan, ground turkey meat, and whole milk) were contained in a 100 mL beaker when measured.
Description of System:
The setup for this experiment (Figure 1) was based around the AvaSpec-ULS2048CL-EVO. This device has the latest technology in spectroscopy, which ensures the platform for years to come. It is a versatile instrument that offers USB3.0 communication, which has ten times the speed of USB2, a fast microprocessor, and 50 times more memory capacity, meaning more spectra can be stored onboard and more overall functionality can be realized. Additionally, this spectrometer can be customized with a wide range of slit sizes, gratings, and fiber optic entrance connectors for a variety of application needs.
The light source used for this experiment was the AvaLight-HPLED-285, a compact, affordable LED light source with a peak wavelength of 285 nm. Designed for fluorescence applications, this high-power version was made for more demanding applications compared to our regular LED light source. The AvaLight-HPLED light sources produce continuous output or pulsed spectral output at different wavelengths via a programmable Pulse Width Modulation (PWM), supplied by an AvaSpec-USB2 or EVO spectrometer (IC-DB26-2 cable needed). All sources have an SMA-905 connector to connect fiber optics to the device and come with a 5V/1.6A power supply.
Other accessories used for this experiment included a specially designed reflection probe with a 45-degree window tip that illuminated the sample and collected measurements of the indirect reflections, a filter holder containing a 305 nm long-pass filter to ensure only the emission spectrum was observed, and a fiber optic cable to connect the filter holder to the spectrometer. All three samples (diluted tryptophan, ground turkey meat, and whole milk) were contained in a 100 mL beaker when measured.
Description of Methodology:
For this experiment, we used the scope mode in AvaSoft, our exclusive custom software package. This is the most common mode for measuring fluorescence as it provides the raw counts for each wavelength. We used an integration time of 200 milliseconds, which can be adjusted to increase or decrease the amount of light being measured at one time and affects the overall magnitude of the reported spectrum. We set averaging to 5, meaning five values were averaged together to provide more consistent spectra results. While not pictured in the setup, we covered all samples to ensure the only light measured was from the light source and did not include ambient light effects.
Test Data and Results:
Displayed below are the fluorescence spectra of the samples.
Analysis:
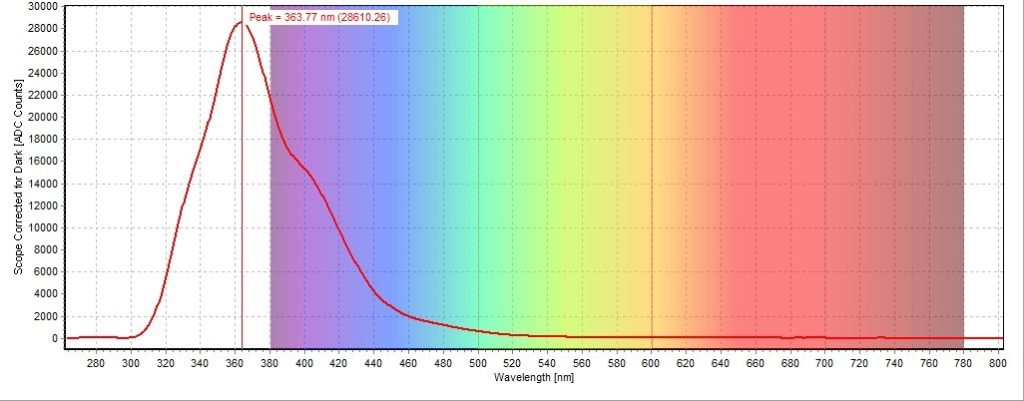
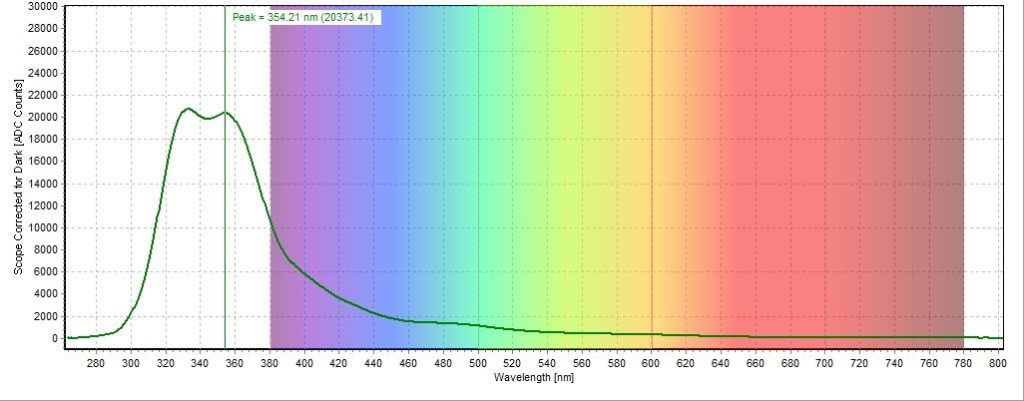
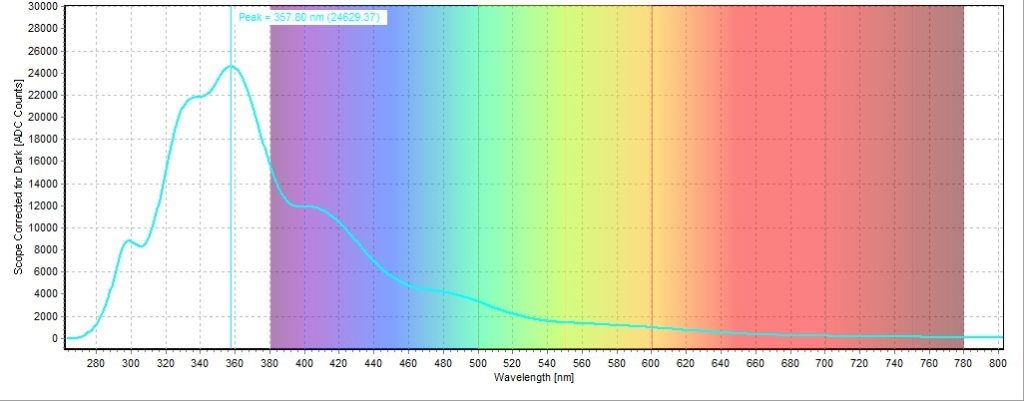
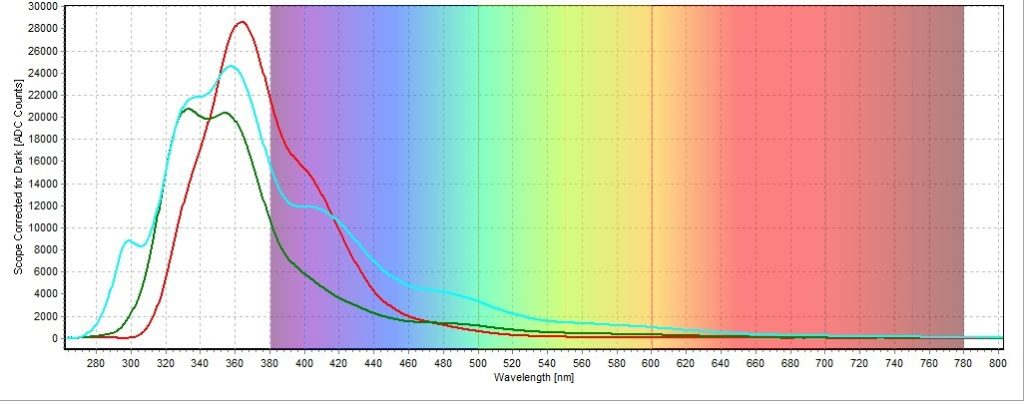
The fluorescence spectrum for the diluted tryptophan sample had a measured emission peak at 363.77 nm (Figure 2). This corresponds well to the reported emission peak for tryptophan, which ranges from 300-400 nm. The fluorescence spectrum for the turkey meat sample showed a lower emission peak at 354.21 nm (Figure 3). This peak is at a lower wavelength than the one measured for the diluted tryptophan sample but is still within the range reported for tryptophan. This spectrum also had a much broader range in wavelength, demonstrating the presence of other proteins and molecules. The fluorescence of the whole milk sample (Figure 4) gave a similar emission peak (357.80 nm) and wavelength range as the turkey sample, but a higher signal in the range of the tryptophan emission peak. This may illustrate that similar proteins and molecules are present in both ground turkey meat and whole milk, but the key signature of tryptophan is much more prevalent in whole milk than turkey. A plot of all three spectra is also provided to illustrate this difference in peak intensity (Figure 5).
Conclusion:
In conclusion, the present experiment seems to discredit the notion that consuming turkey is what causes tiredness after the Thanksgiving meal. The AvaSpec-ULS2048CL-EVO is well suited for a variety of applications thanks to its versatility and wide range of configurations and is future-proof for duplicating the experiment for years to come. In addition to the spectrometer, the AvaLight-HPLED is an excellent light source for fluorescence applications. Please contact Avantes for more information on the configuration that is best suited for your data collection.
 My Cart


