 My Cart
 Examining Spectroscopy And Colorimetry’s Accuracy And Reliability For Color Analysis
Background/Applications:
Colorimetry is a measurement method used to quantify the color of a substance or object by the intensity and wavelength of light absorbed, transmitted, or reflected by the sample. This is often expressed in terms of the RGB (red-green-blue) scale but can also be represented in HEX scale and L*a*b*. The L*a*b* color space was originally defined by the International Commission on Illumination (CIE) in 1976, with L* defining lightness from black (0) to white (100), a* defining green (-128) to red (+127) and b* defining blue (-128) to yellow (+127). These values were defined such that a one-unit change in any value would roughly correspond to a visually perceived change in color.
This experiment aims to measure the color values with respect to the L*a*b* color space of 13 different paint samples, including two purple samples (‘Blue Ember’ and ‘Merlin’s Robes’), two brown samples (Deep Earth and Gondola), three white samples (Polar White, Ivory Lace, and Summer Gray), and six green samples (Four-Leaf Clover, Deep Mint, Cool Bluegrass, Green Water, Phoenix Tears, and Spearmint Haze), more of which were chosen to commemorate St. Patrick’s Day, which celebrated in March (Figure 1). A white reference tile will be used as reference material. Measurements will be taken in the visible (VIS) spectral range to purely compare color differences and not differences in the ultraviolet or infrared spectra.
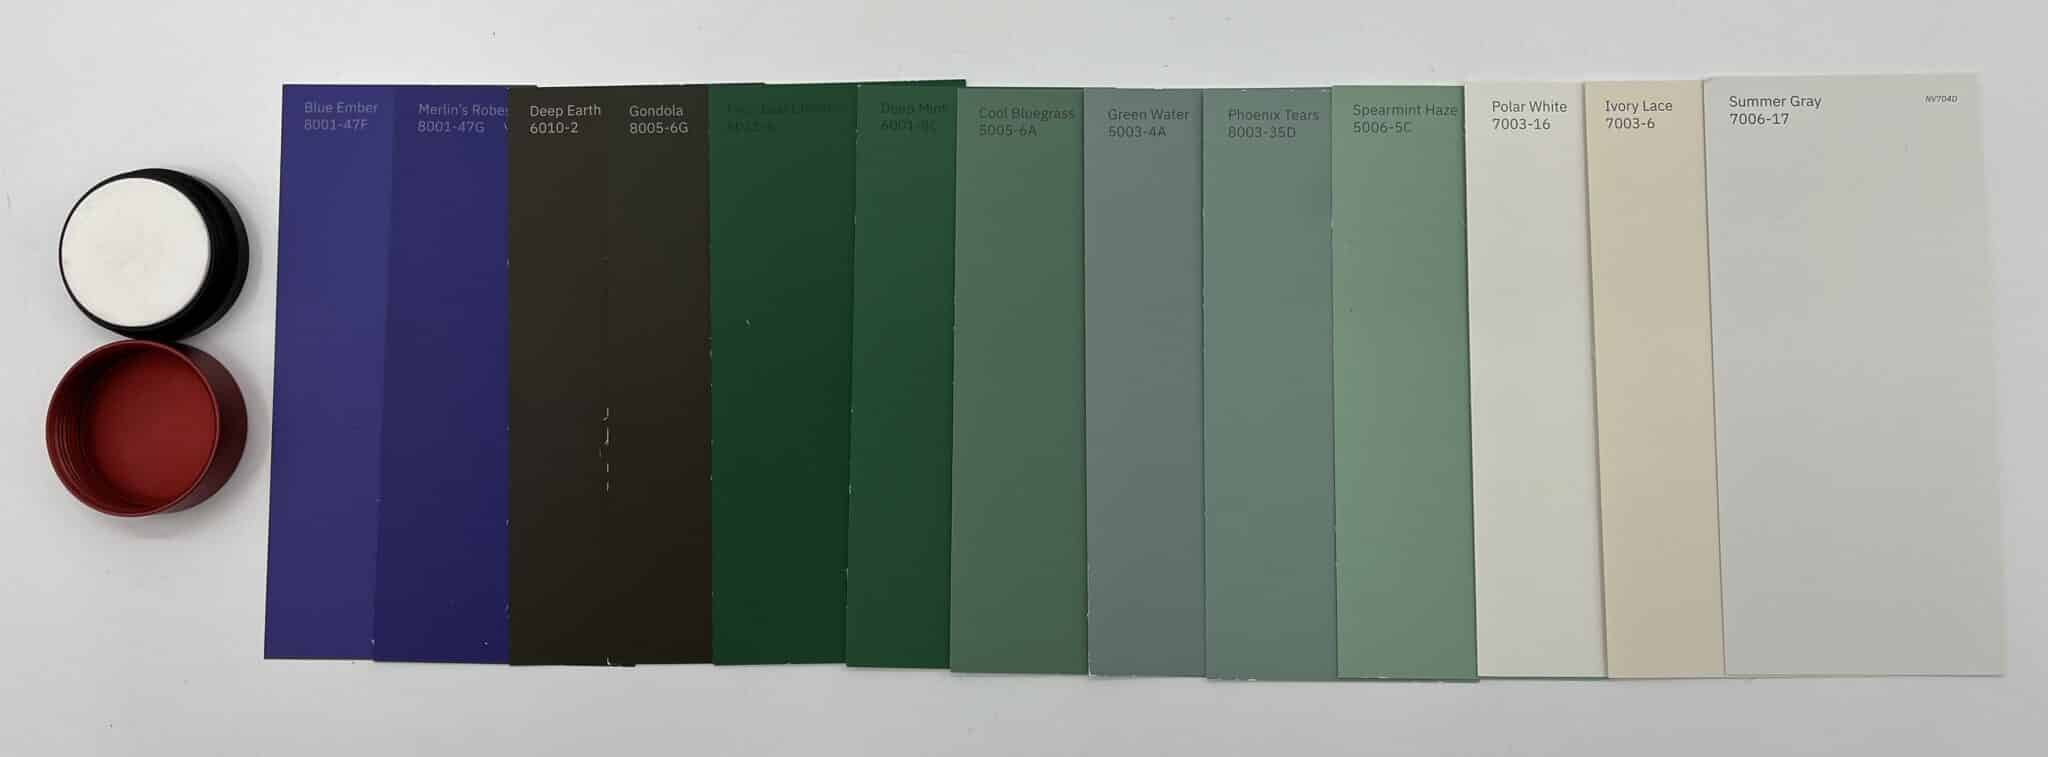
Figure 1: Paint samples and reference tile used for the experiment (from left to right: white reference tile, Blue Ember, Merlin’s Robes, Deep Earth, Gondola, Four-Leaf Clover, Deep Mint, Cool Bluegrass, Green Water, Phoenix Tears, Spearmint Haze, Polar White, Ivory Lace, and Summer Gray).
 Description of System:
For our experiment, we chose to use a setup using our Avaspec-ULS2048CL-EVO. The instrument has been used in the past for absorbance and reflectance measurements and is now being utilized for color measurements, highlighting its versatility. It has USB 3.0 communication, which is 10 times faster than USB2, a CMOS detector, a fast AS-7010 microprocessor, and 50 times more memory capacity. This means it can store more spectra onboard and offer greater overall functionality. Additionally, the spectrometer can be tailored to specific application needs by using different slit sizes, gratings, and fiber optic entrance connectors. The light source used for this experiment was the AvaLight-XE-HP, a high-powered pulsed xenon light source. This light source comes in a compact housing, making it well-suited for integration into customer systems. Compared to the AvaLight-XE, which has a maximum power of 2 W, the AvaLight-XE-HP provides significantly more power (6 W). When connected to an AvaSpec spectrometer via our custom interface cable, the number of flashes per scan can be set in our AvaSoft software, and the flashes are synchronized with the data collected by the spectrometer.
Other accessories used for this experiment included a white reference tile (WS-2) that was used as the reference for both the reflection measurement and color measurement, a 200-micron core fiber optic reflection probe (FCR-7UVIR200-2-BX) to connect the integrating sphere to the spectrometer, a probe holder (RPH-1) to hold the probe consistently at a 45-degree angle, and a custom interface cable to connect the AvaLight-XE-HP to the AvaSpec-ULS2048CL-EVO to control flashes per scan and to power the light source. This interface cable was designed by our engineering team and highlights some of the custom-build options that can be assembled for our customers.
Test Data and Results:
Displayed below are the spectra of the samples in scope mode, the reflectance spectra of the samples, and a table of the Color mode data for each sample.
Download Avasoft and Excel Data


Analysis:
While measurements for the paint samples were taken in Reflectance mode and Color mode, a graph of the paint samples in scope mode was also included (Figure 3). These spectra show why this mode is not ideal for color measurements. While it is clear that the white paint samples have the highest count intensity and the brown paint samples have the lowest number of counts, the purple samples are between the green samples, showing little indication which sample is which without the color labeling of each data set. The Reflectance mode spectra are much more informative, with the white samples having high reflectance across the visible spectrum, the green samples ranging from medium to low reflectance across the visible spectrum but always showing increased reflectance in the green region, the purple samples showing higher reflectance in the blue-purple region, and the brown paint samples showing low reflectance across the visible spectrum (Figure 4).
The L*a*b* color space values for each sample are given in the table (Table 1). The purple paint samples have relatively low L* values, indicating they are a darker lightness. The positive a* and negative b* values mean they are a mix of red and blue, which results in purple. The brown paint samples have even lower L* values, meaning they are measured to be darker than the purple samples. The a* values being close to zero means they have a very even mix of green and red, and the positive b* values suggest the samples are more yellow than blue. These seem to be accurate descriptions of typical shades of brown. The green paint samples had a wide range of L* (40.46 to 79.52) and b* values (-0.53 to 16.2), but all samples had negative a* values, albeit with a wide range as well (-9.77 to -40.8). These negative a* values indicate more green than red in each sample, which is obvious for green samples. The range of b* indicates the sample range from slightly blue to moderately yellow. The range of L* is indicative of the range of lightness in the green paint samples. Lastly, the white paint samples all showed high L* values close to 100, indicating they have high lightness, and a* and b* values close to zero, showing a balanced mix of green, red, blue, and yellow shades. This is consistent with the fact that white is a combination of all colors in the visible spectrum. The slightly higher b* value of Ivory Lace can be seen in that it appears slightly more yellow than the other two white paint samples. An image of the Color mode module is included to provide an example of the addon in use (Figure 5).
Conclusion:
In conclusion, the present experiment highlights the use of both the Reflectance mode and Color mode in AvaSoft to measure color samples, with Reflectance mode giving a general idea of the broad spectrum of a sample and Color mode giving quantitative values in terms of the L*a*b* color space. The AvaSpec-ULS2048CL-EVO is well suited for a variety of uses, including absorbance and reflectance measurements as shown previously, and color measurements as shown in this experiment. The AvaLight-XE-HP is a Zenon light source that is well-suited for applications where high power is needed or a compact form factor is a must. The interface cable connecting the AvaLight-XE-HP and the AvaSpec-ULS2048CL-EVO highlights the capabilities of our engineering team to provide custom assemblies and solutions for customer needs. Please contact Avantes for more information on the configuration that is best suited for your data collection.