 My Cart
 Comparison of Chocolate Types Utilizing Absorbance Spectroscopy
Background/Applications:
Valentine’s Day is one of the most popular holidays both nationally and globally. The holiday of romance as we know it began around the 14th century as a celebration of love and a time to give affectionate greetings and gifts, the most popular of which being beautiful-smelling flowers or sweet-tasting chocolates. While the term ‘chocolate’ includes a very broad category of sweets, the specifications of what defines certain chocolates can be very strict. Any chocolate defined as ‘milk chocolate’ must contain at least 12% milk and 10% chocolate liquor, which includes cocoa butter and cocoa solids. While this is the minimum, higher-quality milk chocolates may contain as much as 30-40% cocoa. The remaining contents may be a combination of sugar, vanilla, emulsifiers, and other flavorings. White chocolate must contain at least 14% milk and 20% cocoa butter but contains no cocoa solids, which removes the fruity and bitter tastes associated with other chocolate types. Dark chocolate must contain at least 35% chocolate liquor, with this percentage often being closer to 60-70% and as high as the mid-90 percentages, and no milk, though trace amounts are usually present. While these chocolate variants can often be distinguished by their visible hue and their brittleness, the required content percentages mean they can also be identified by their molecular composition. This type of characterization can be done using many methods, including NIR spectroscopy.

Figure 1: Five chocolate samples used for the experiment (from left to right: milk chocolate, cheap milk chocolate, white chocolate, dark chocolate with 78% cacao, and dark chocolate with 92% cacao).
This experiment aims to measure differences between five different types of chocolate, including milk chocolate, cheap milk chocolate, white chocolate, dark chocolate with 78% cacao, and dark chocolate with 92% cacao. Measurements will be taken in the near-infrared (NIR) spectral range to avoid trivial measurement differences such as color.
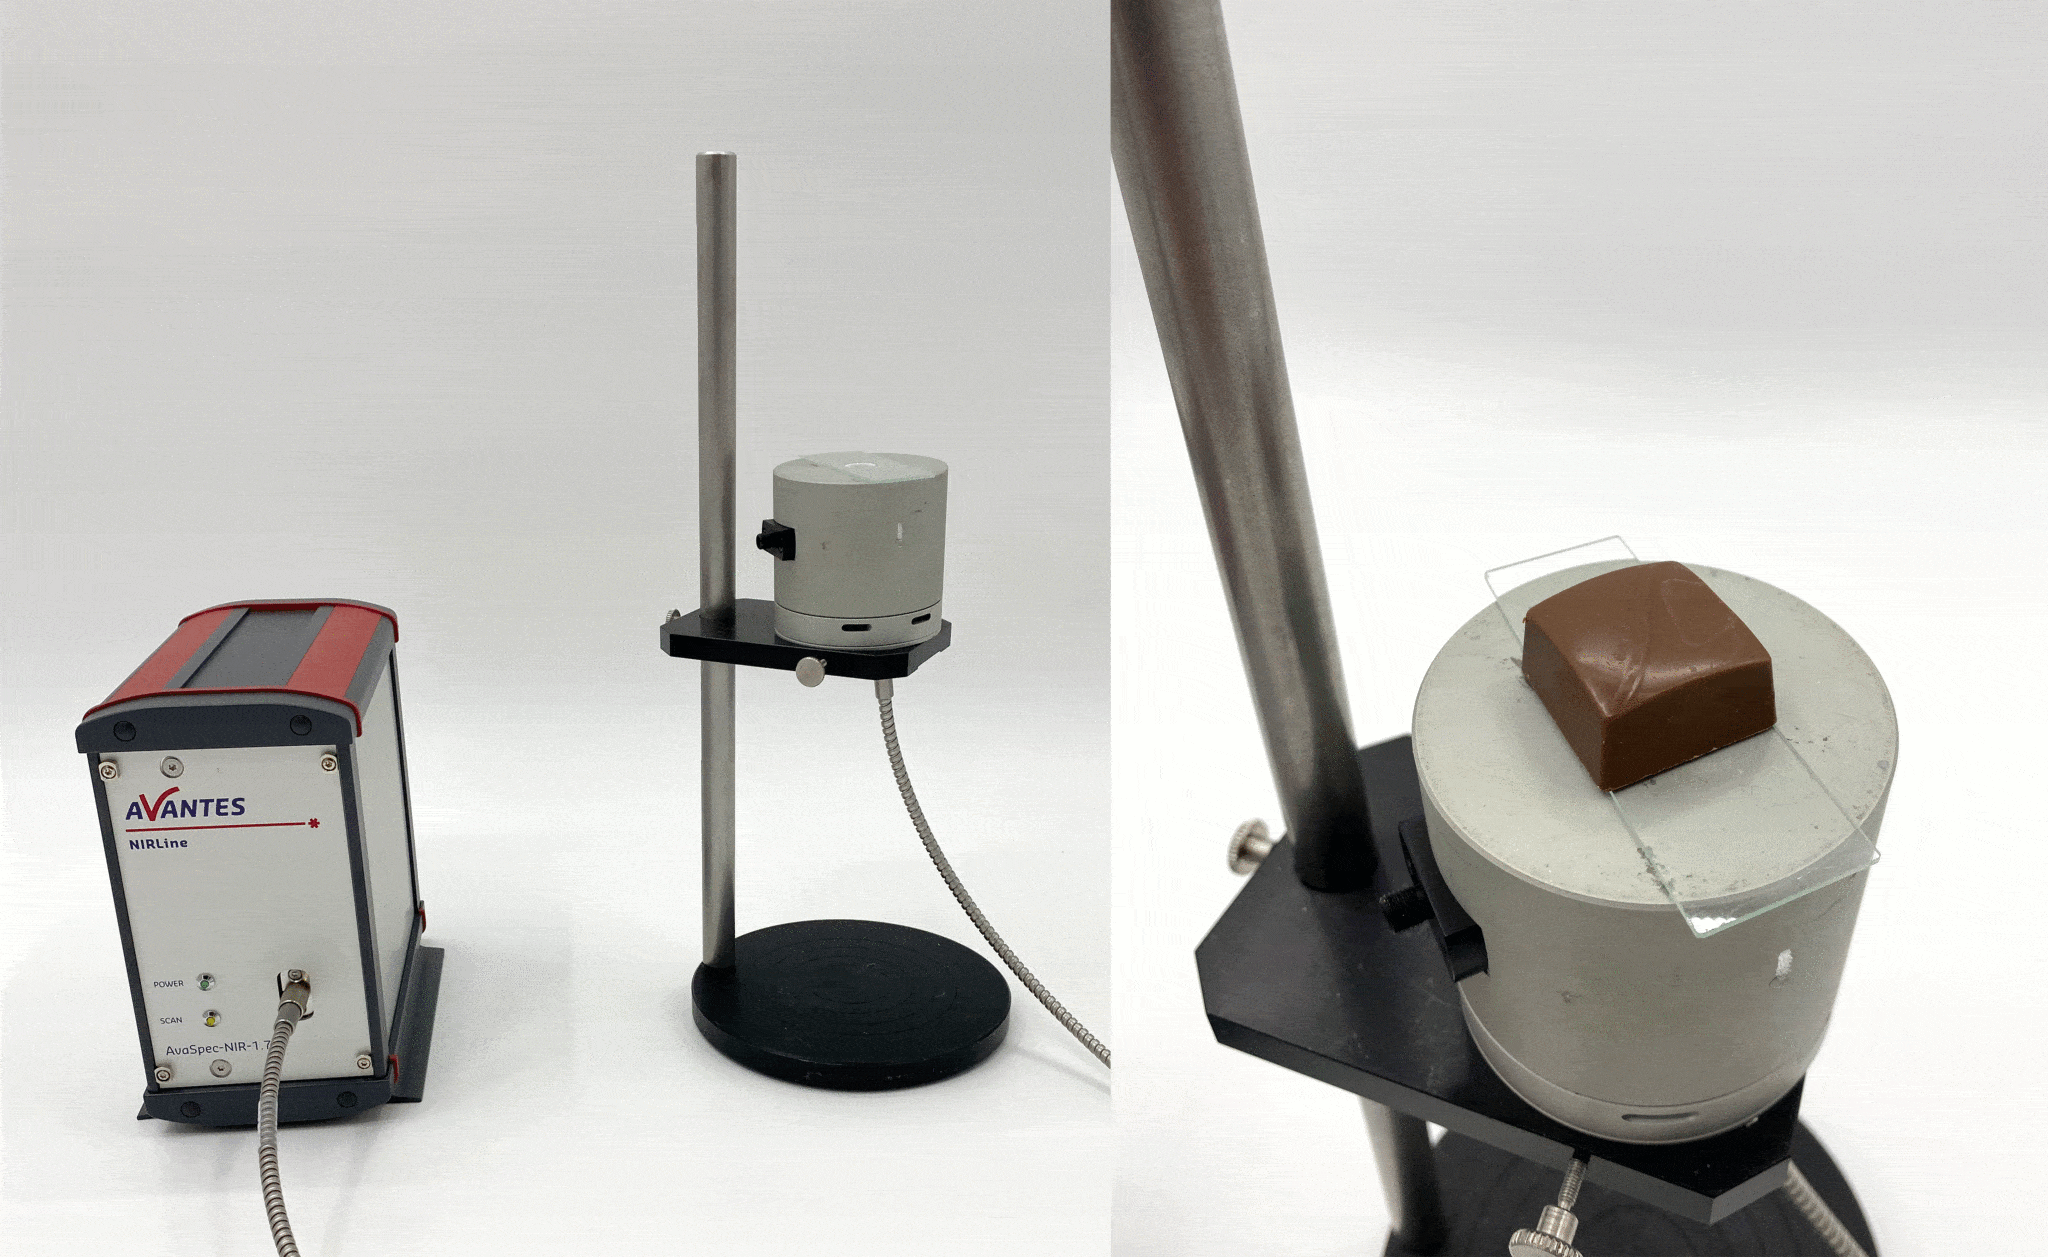
Figure 2: Experimental setup for chocolate measurement (left). A close-up of the integrating sphere and chocolate sample with the glass slide separating the two (right).
Description of System:
The setup for this experiment (Figure 2) was based around the AvaSpec-NIR256-1.7-EVO. Specifically for measurements in the NIR range up to 1.7 μm, this model pairs our high-sensitivity optical bench with next-generation electronics for exceptional performance, including 0.53 ms/scan sample speed and integration times as fast as 10 μs. The AvaSpec-NIR256-1.7-EVO is equipped with our trusted InGaAs (Indium-Gallium-Arsenide) array detector and our ultra low-noise electronics board with both USB3.0 and Giga-Ethernet connection ports onboard. Additional features include multiple grating and replaceable slit options, as well as digital and analog I/O ports, which can be used to control the shutter or pulse of connected light sources and the gain setting of the spectrometer, with either High Sensitivity or Low Noise.
The light source used for this experiment was a built-in halogen light in our AvaSphere-50-LS-HAL-12V integrating sphere. While specifically designed for reflection applications, this integrating sphere is also useful for low reflecting materials and NIR spectral measurements, where signal strength can be limited. The built-in halogen light source provides diffused halogen light on the sample without the losses associated with fiber-optic coupling, with up to 160 times more light on the sample compared to our standard reflectance integrating sphere. The AvaSphere-50-LS-HAL-12V has an internal diameter of 50 mm, a 10 mm sample port, an SMA-terminated reference port, and a direct collimated SMA-port for collection of the signal with any of our AvaSpec spectrometers.
Other accessories used for this experiment included a glass slide to separate the chocolate samples from the integrating sphere entrance and a 600-micron core fiber optic cable (FC-UVIR600-1-BX) to connect the integrating sphere to the spectrometer.
Description of Methodology:
Each sample was a piece of chocolate broken from a larger chocolate bar except the cheap milk chocolate sample, which was its own piece of chocolate. Each sample was stored in a drawer in a room with a temperature around 70°F to ensure no melting or blooming occurred. When analyzed, each chocolate sample was individually placed on a glass slide that was then placed over the sample port of the integrating sphere (Figure 2). This glass slide prevented any small amount of chocolate from entering the integrating sphere and potentially contaminating the sphere. Additionally, this made measurement distance more consistent, which in turn resulted in more accurate comparisons between samples.
For data analysis, we used the scope-minus-dark mode in AvaSoft, our exclusive custom software package. This is a versatile mode used for many measurement applications. In this mode, the dark spectrum (what the spectrometer measures with no light source) is subtracted from the raw counts (i.e., scope mode) for each wavelength. This helps minimize noise in the spectrum, which can be especially useful when low signal is a limitation. We used an integration time of 10 milliseconds, which can be adjusted to increase or decrease the amount of light being measured at one time and affects the overall magnitude of the reported spectrum. We set averaging to 10, meaning ten values were averaged together to provide more consistent spectra results.
Test Data and Results:
Displayed below are the spectra of the samples.

.")
.")
.")
.")
, cheap milk chocolate sample (red), white chocolate sample (light green), dark chocolate sample with 78% cacao (dark red), and dark chocolate sample with 92% cacao (dark green), shown together for comparison.")
Analysis:
The spectrum for the milk chocolate sample had a measured peaks at 1128.26 nm and 1322.60 nm with magnitudes of 40998.40 counts and 52515.80 counts, respectively (Figure 3). The spectrum for the cheap milk chocolate sample had peaks at 1128.26 nm and 1318.60 nm with magnitudes of 38705.30 counts and 46874.60 counts, respectively (Figure 4). The spectrum for the white chocolate sample had measured peaks at 1124.16 nm and 1318.60 nm with magnitudes of 44033.80 counts and 51613.40 counts, respectively (Figure 5). The spectrum for the dark chocolate sample with 78% cacao had measured peaks at 1128.26 nm and 1322.60 nm with magnitudes of 34223.40 counts and 48308.30 counts, respectively (Figure 6). The spectrum for the dark chocolate sample with 92& cacao had measured peaks at 1128.26 nm and 1322.60 nm with magnitudes of 34303.70 counts and 48289.00 counts, respectively (Figure 7). A plot of all five spectra is also provided to illustrate the differences in peak intensity (Figure 8).
All chocolate samples reported a peak at 1128.26 nm except for the white chocolate sample, which reported a peak in this area at 1124.16 nm, though this does not appear to be a substantial difference in peak wavelength. The white chocolate sample reported the highest number of counts at this wavelength, followed by the milk chocolate sample and then the cheap milk chocolate sample. The dark chocolate samples had the lowest counts at this wavelength and were almost identical. Based on these magnitudes, it could be hypothesized that this wavelength could be an indicator of cocoa butter content. White chocolate must contain at least 20% cocoa butter (the highest percentage of the measured chocolates), and milk chocolate in general contains more cocoa butter than dark chocolate, which opts to use more chocolate solids instead to achieve its more bitter and fruity taste. Higher-quality milk chocolates typically have a higher percentage of cocoa (either butter or solids), which would explain why the cheap milk chocolate sample reported a lower magnitude at this wavelength.
The second peak seen around 1320 nm is less apparent in its origin. With the milk chocolate sample reporting the highest number of counts at this wavelength, followed by white chocolate, then both dark chocolate samples, then the cheap milk chocolate sample, there is no obvious component that this may be measuring. More complex analysis could help determine the measurements observed, though it is evident that there are clear differences between the number of counts seen between the milk chocolate sample, white chocolate sample, cheap milk chocolate sample, and the two dark chocolate samples, with the dark chocolate samples again having nearly identical magnitudes at this wavelength.
Conclusion:
In conclusion, the present experiment highlights the differences that can be observed between different types of chocolate using NIR spectroscopy, though further analysis must be used to fully interpret and quantify these measured differences. The AvaSpec-NIR256-1.7-EVO is a highly versatile NIR spectrometer with plenty of available options to match the bandwidth and requirements fitting your application. The AvaSphere-50-LS-HAL-12V is specifically designed for reflectance measurements but is effective for any applications where limited signal strength may be an issue, such as NIR spectral measurements. Please contact Avantes for more information on the configuration that is best suited for your data collection.