 My Cart
 Fluorescence of Anthocyanins in Blueberries
Background/Applications:
Anthocyanins are water-soluble pigments that are responsible for the red, purple, and blue coloring in fruits and vegetables. The colored anthocyanins are used as natural food colorants, and as potential pharmaceutical ingredients that give various health benefits. Anthocyanins possess antibacterial and antioxidative qualities that have the ability to improve visual and neurological health and protect against various non-communicable diseases.
The most common anthocyanins in fruits and vegetables are cyanidin, delphinidin, pelargonidin, peonidin, malvidin, and petunidin. Blueberries contain five out of the six anthocyanins (all except pelargonidin) among many others. Each anthocyanin visibly emits a different color (Figure 1). The color and stability of these pigments are influenced by pH, light, temperature, and structure. In acidic conditions, anthocyanins appear red but turn blue when the pH increases.
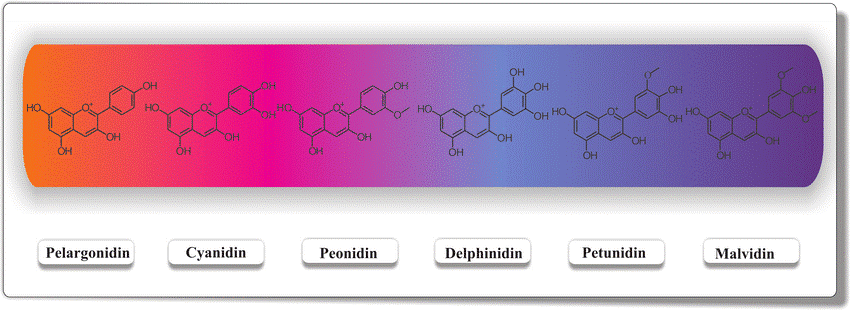
Figure 1: Visible colors of the six common anthocyanins
 Description of System:
For this experiment, we used Avantes’ top-of-the-line UV/VIS spectrometer, the AvaSpec-HERO (Figure 1). The AvaSpec-HERO is built up around our High-Sensitivity, Compact (HSC), 100mm optical bench offering a numerical aperture (NA) of 0.13 and a cooled, back-thinned CCD detector (1024×58 pixels). Electronics-wise, the HERO uses our state-of-the-art AS7010 board, which includes a high-performance Analog Digital converter with excellent noise performance and the ability to support high-speed communication through USB 3.0 and or gigabit ethernet. Due to the high sensitivity of this instrument, the HERO is ideal for fluorescence measurements.
The light source used was ThorLabs’ OLS2 Fiber Illuminator. This source is a 150 W high-output halogen lamp with variable intensity control. The light bulb used in the illuminator was the OSL2B. The bulb type is 150W, 3200 K, and EKE/10H. This light source was used due to the high intensity of the halogen light.
The other accessories used in this experiment included a 600-micron broadband fiber, a direct-attach filter holder, and a direct-attach cuvette holder. The direct-attach filter holder (FH-DA) can hold 0.5-inch filters of 1 to 8 mm thick. The filter holders are equipped with two quartz collimating lenses for the UV/VIS/NIR range. A BPH4 bandpass filter was used to excite the sample at the wavelength of 490. The direct-attach cuvette holder (Part CUV-DA) features two 90-degree and one 180-degree thread that allows the COL-UV/VIS collimating lens to be connected for absorbance or fluorescence measurements. Each of the CUV-DA series cuvette holders includes two SiO2 aluminum mirrors to further fluorescence signals. These mirrors are mounted at 90 degrees to the excitation source and emission output. The CUV-DA has a 5 mm wide filter slot.
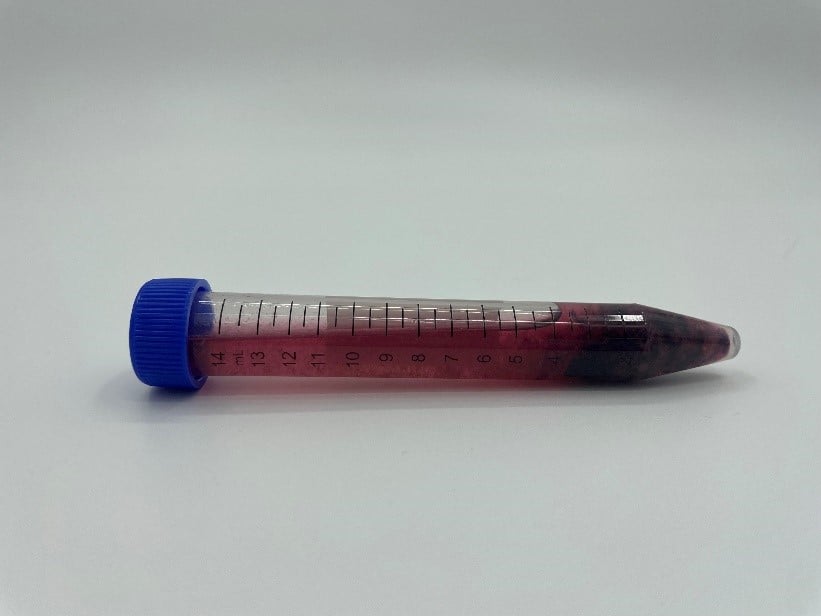
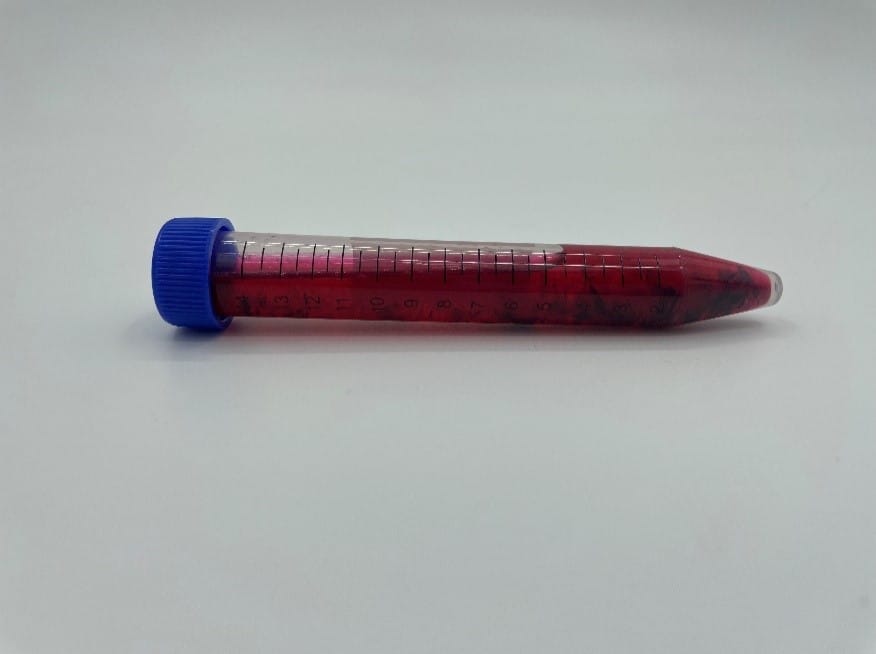
Description of Methodology: Preparing the sample began by washing and drying the blueberries. The blueberries were then blended for thirty seconds until a semi-liquid substance was formed. Two grams of the blended blueberries were then added to a centrifuge tube along with 10 mL of an ethanol solution (Figure 3). The ethanol solution was a 1:1 ratio of ethanol and deionized water. To lower the pH of the sample, 0.5 mL of 30% hydrochloric acid (HCl) was added to the centrifuge tube (Figure 4). Adding the HCl lowered the pH from around four to one. This acidic addition changed the color of the sample to a more pinkish-reddish color. The tube was then manually shaken and then put in a centrifuge for fifteen minutes.
-
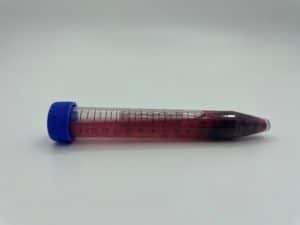
- Figure 3: Blended Blueberries with Ethanol Solution
-
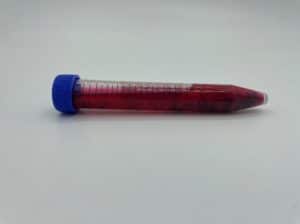
- Figure 4: Blended Blueberries with ethanol solution and HCI
After the centrifuge, the sample was strained in a gravity filtration system. This system included a funnel, rubber fitting, beaker, and filtering paper. The filtering paper was saturated with more of the ethanol solution to prepare for the filtration. The sample was then poured into the filter and left for five minutes. The resulting color was a bright magenta color. Once the sample was filtered through, we took 0.5 mL of the sample and added it to two mL of the ethanol solution in a fluorescence cuvette (Figure 5). The pH raised slightly to one, but it was nothing too drastic because the HCl used was highly concentrated. The color was the same magenta hue just less concentrated. The second dilution was necessary to lighten the color so that the spectrometer could read the sample. The sample was then kept at four degrees Celsius in the dark until it was ready to be tested in our fluorescence system.
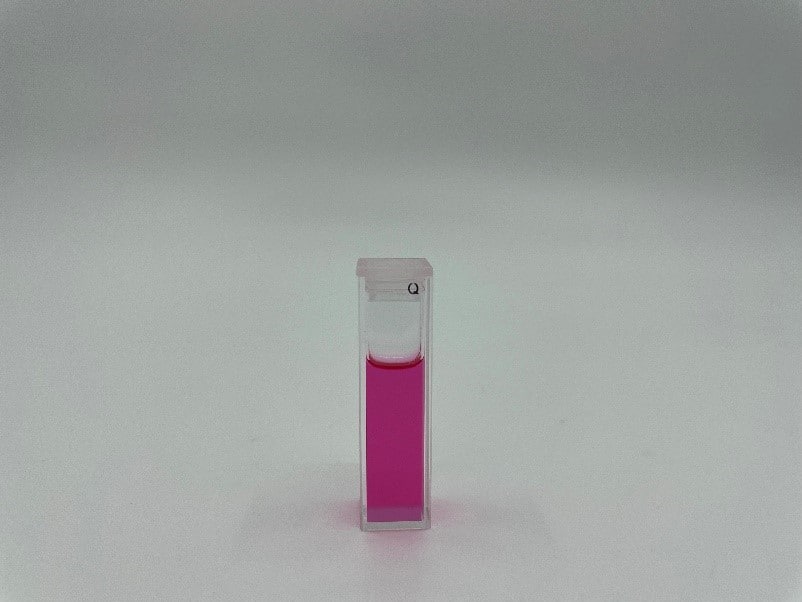
Figure 5: Final sample for anthocyanin testing
Out of the five anthocyanins in blueberries mentioned above, the initial color pointed to peonidin being the most prevalent. Before adding the HCl, the color was a pinkish purple. Once the acid was added, the color became bright magenta. In acidic conditions, anthocyanins appear redder, and in basic conditions, they appear bluer. The final coloring pointed to the peonidin veering more toward the cyanidin coloring. This is a reasonable conclusion since peonidin is more stable in higher pH conditions, while cyanidin is more stable in lower pH conditions.
Test Data and Results: To begin testing, we set the integration time to twenty seconds and an average time of one on our software. The anthocyanin fluorescence was difficult and sensitive to detect, so the long integration time helped to compile enough data for a readable spectrum. A dark reference was taken and then the sample was placed in the direct-attach cuvette holder. Fluorescence is measured in scope mode in our AvaSoft software. Since we took a dark reference, our spectra were measured in scope corrected for dark mode. This mode just subtracts the reference for a more accurate measurement.
Blueberry anthocyanin has an excitation peak at 485nm and an emission peak in the range of 530-620nm. A 490 nm bandpass BPH4 filter was used to excite the emission peak. Bandpass filters isolate a band of wavelengths from the whole spectrum by providing a band of high transmission and bands of high rejection of spectral energy. So, using this 490 nm filter, the sample was excited and then could emit the emission peak of fluorescence. The emission peak range differs because of the different anthocyanins present as well as the setup of the experiment. Since anthocyanins are sensitive to pH, light, and temperature, the setup of the experiment can alter results.
We ran the experiment three times, and all of the spectra were essentially the same. In the last test we ran, the excitation peak was at 493.02 nm and the emission peak was at 616.33 nm (Figure 6). The emission peak was the fluorescence peak of the anthocyanin sample (Figure 7).
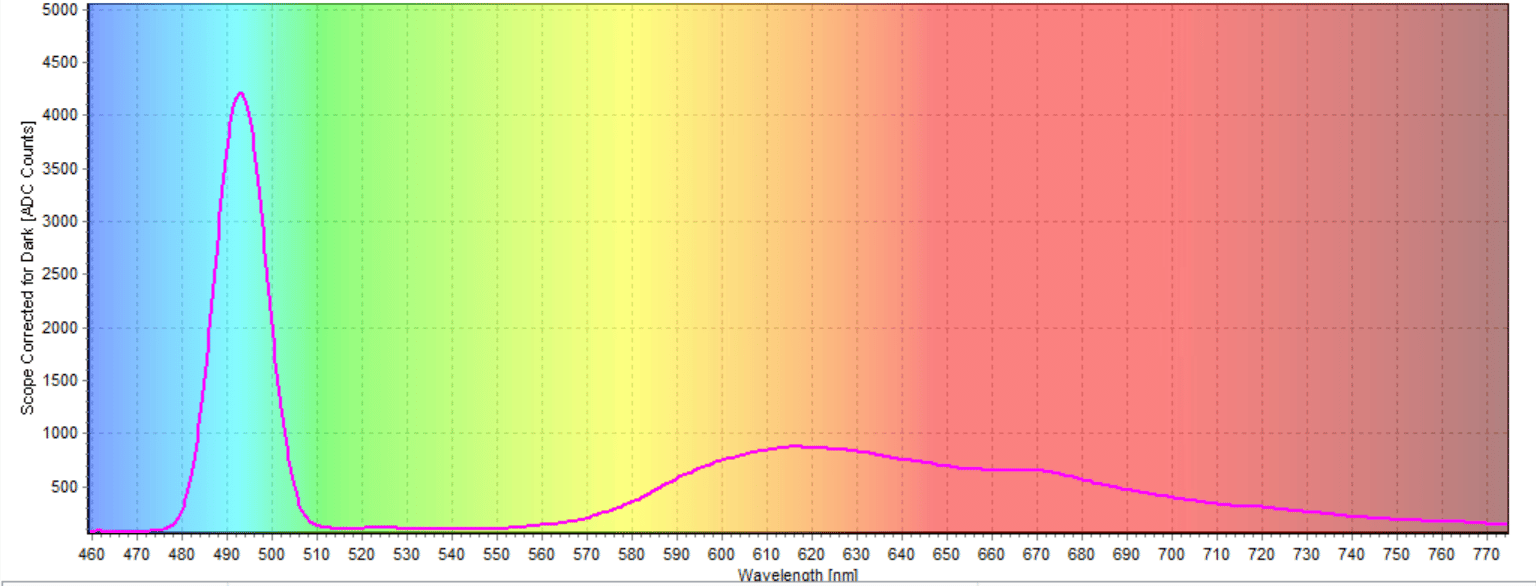
Figure 6: Excitation and Emission peaks of the sample
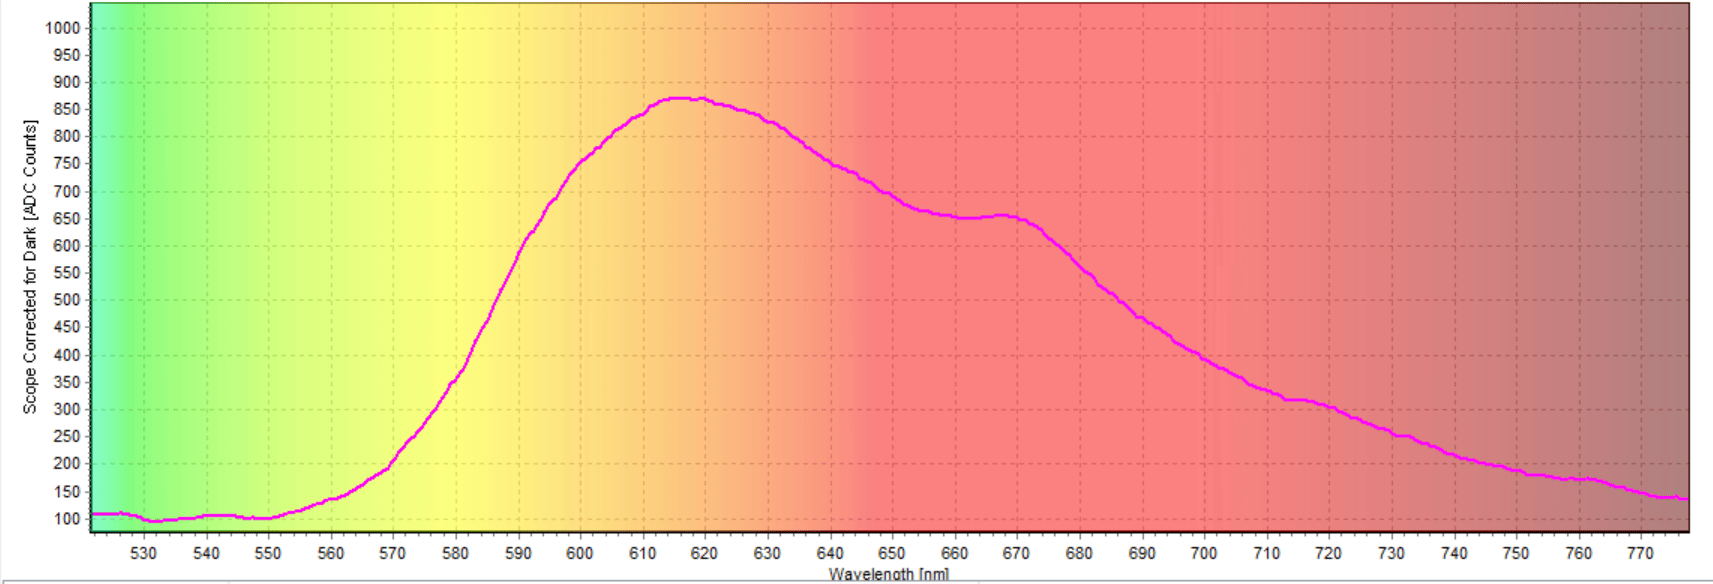
Figure 7: Fluorescence peak of the anthocyanins
The magenta anthocyanin sample fluoresced at around 620 nm which lies in the orange region. Fluorescence, by definition, is the emission of electromagnetic radiation caused by the excitation of atoms in a material, which then reemits almost immediately. The fluorescence spectra for the sample were not as immediate as other studies done on anthocyanins. Wavelength emission peaks for blueberry anthocyanins are more commonly found closer to 530nm. Different preparative steps probably caused the range to be different in this experiment.
Conclusion: Anthocyanins are sensitive water-soluble pigments that contribute to the red, purple, and blue colors in fruit and vegetables. Anthocyanins are highly studied lately due to the newfound health benefits that they possess. The most common anthocyanins in fruits and vegetables are cyanidin, delphinidin, pelargonidin, peonidin, malvidin, and petunidin. Blueberries contain five out of the six anthocyanins (all except pelargonidin). The color and stability of anthocyanin pigments are influenced by pH, light, temperature, and structure. Any of these factors can change the color and structure of the pigments.
In this experiment, we tested the fluorescence of anthocyanins in blueberries to find the max peak at 616.33 nm. This wavelength lies in the orange range meaning that the blueberry magenta sample fluoresced an orange hue. A procedure was made to find a correct color concentration and pH that would allow for spectroscopic readings. The color of the sample was changed with the addition of hydrochloric acid in the preparative sampling steps. This color change shifted the predominant anthocyanin (peonidin) further left on the reddish pink spectrum, where cyanidin lies. Peonidin is more stable in higher pH conditions, while cyanidin is more stable in lower pH conditions.
The experiment verified the sensitivity of anthocyanin nature as well as the main anthocyanins in blueberries. The results deviated towards the end of the range for anthocyanin fluorescence, but that was probably due to the sampling process setup and pH level. Overall, the delicate pigments were detected by Avantes’ spectroscopic equipment which allowed for the analysis of color change in the anthocyanin spectrum due to the addition of an acid.