My Cart
 Python Project Development for Spectroscopy (part 2)- Technote
This post is part of a series on “Creating a Python Spectroscopy Project”
Developing a customized Python project application to integrate with Avantes Spectrometers is easier than you might expect. Join Justin Spott, regional sales engineer, with a new series of “tech notes” that explores this topic in greater detail.
Part 1: Installing the AvaSpec library
Subscribe to our newsletter to get the latest updates on this project!
Python is becoming very popular with scientists (the author included) because of its readability, ease of use, and availability. In this tutorial, I will walk you through connecting to and taking data with your Avantes spectrometer. This tutorial assumes you have already installed the AvaSpec library and Python. I will be using Anaconda and its IDE Spyder.
Python Project File/Folder Structure
We will start by creating a project directory. This folder needs to contain the avaspec.dll or avaspecx64.dll library. We will also need a python wrapper. Both the library and wrapper can be found in the AvaSpec-DLL install directory. The default install directory is C:\AvaSpec-DLL_<version_nr> for the 32-bit version and C:\AvaSpecX64-DLL_<version_nr> for the 64-bit version of the Library.
mkdir PySpec
cd PySpec
copy C:\AvaSpecX64-DLL_9.9.3.0\examples\PyQt5\avaspecx64.dll
copy C:\AvaSpecX64-DLL_9.9.3.0\examples\PyQt5\avaspec.py
Connecting to the Spectrometer
Connecting to the spectrometer is done in three steps: initializing the library, asking for information on the spectrometers available to the library, and retrieving the spectrometer-specific handle from the library.
First, AVS_Init initializes the library with the a_Port parameter by looking for USB devices (0) Ethernet devices (256), or both (-1). AVS_GetNrOfDevices can be called at any time to refresh the device list in the library.
>>> AVS_Init(0)
1
>>> ret = AVS_GetNrOfDevices()
>>> ret
1
AvsIdentityType is a simple structure that contains 3 attributes: the serial number, status, and user friendly name of the spectrometer. We use AvsIdentityType and the number of devices and to build the buffer a_pList required by AVS_GetList. AVS_GetList also requires the size of the buffer a_pList – 75 bytes times the number of devices. GetList returns a tuple containing the size required for the deviceList buffer (position 0), and an AvsIdentityType for every spectrometer.
>>> req = 75*ret
>>> a_pList = AvsIdentityType * ret
>>> AVS_GetList(req,req,a_pList)
(75, <avaspec.AvsIdentityType at 0x1b25d99cf48>)
>>> ret[1].SerialNumber, ret[1].Status
(b'1709195M1', b'\x01')
Passing an AvsIdentityType to AVS_Activate, gives back an AvsHandle to be used in subsequent function calls.
>>> handle = AVS_Activate(ret[1])
Configuring the Spectrometer
With the handle, we can now prepare the spectrometer to collect data. We call AVS_GetParameter to retrieve configuration information about the spectrometer in the form of a DeviceConfigType. From here we retrieve the number of pixels, which we’ll use to get the wavelength data and later plot the spectrum. Next, use AVS_GetLambda to retrieve the wavelength calibration for each pixel – we’ll iterate through and store the values for later.
>>> config = DeviceConfigType
>>> ret = AVS_GetParameter(handle, 63484, 63484, config)
>>> pixels = ret[1].m_Detector_m_NrPixels
>>> wavelengths = []
>>> ret = AVS_GetLambda(handle,wavelengths)
>>> for pixel in range(pixels):
>>>     wavelengths.append(ret[1][pixel])
Create a MeasConfigType to hold the acquisition data. Here is a brief overview of these settings; always contact your Avantes salesperson for any further questions about these:
m_StartPixelandm_StopPixellet you retrieve a smaller portion of the spectrum. This can increase framerate; but generally you’ll want to collect the entire spectrum.m_IntegrationTimeis the acquisition time for each spectrum, in milliseconds.m_IntegrationDelayallows you to set a delay before the sensor starts collecting data. This is useful for filtering out noise from an experiment like in the LIBS experiment described here.m_NrAveragesallows you to perform on-spectrometer averaging, increasing sensitvity.m_CorDynDark_m_Enableandm_CorDynDark_m_ForgetPercentageare part of theDarkCorrectionType, settings for the Correct for Dynamic Dark [link] setting.m_Smooting_m_SmoothPixandm_Smoothing_m_SmoothModelenable smoothing settings.m_SaturationDetectioncontrols the saturation detection feature.- The next three settings are part of the
TriggerType.m_Trigger_m_Mode,m_Trigger_m_Source, andm_Trigger_m_SourceTypecontrol the triggering. - The final five settings are part of the
ControlType. These settings change how the spectrometer interacts with light sources.
>>> measconfig = MeasConfigType
>>> measconfig.m_StartPixel = 0
>>> measconfig.m_StopPixel = pixels - 1
>>> measconfig.m_IntegrationTime = 50
>>> measconfig.m_IntegrationDelay = 0
>>> measconfig.m_NrAverages = 1
>>> measconfig.m_CorDynDark_m_Enable = 0
>>> measconfig.m_CorDynDark_m_ForgetPercentage = 100
>>> measconfig.m_Smoothing_m_SmoothPix = 0
>>> measconfig.m_Smoothing_m_SmoothModel = 0
>>> measconfig.m_SaturationDetection = 0
>>> measconfig.m_Trigger_m_Mode = 0
>>> measconfig.m_Trigger_m_Source = 0
>>> measconfig.m_Trigger_m_SourceType = 0
>>> measconfig.m_Control_m_StrobeControl = 0
>>> measconfig.m_Control_m_LaserDelay = 0
>>> measconfig.m_Control_m_LaserWidth = 0
>>> measconfig.m_Control_m_LaserWaveLength = 0.0
>>> measconfig.m_Control_m_StoreToRam = 0
Finally, we can send the configuration to the spectrometer!
>>> AVS_PrepareMeasure(handle, measconfig)
0
Collecting and displaying spectral data
Now we can have the spectrometer begin taking data.
scans = 1
AVS_Measure(handle, 0, scans)
A 50 ms exposure time and single scan will complete quickly. Longer experiments may require us to wait for the collection to finish – so we’ll add a small check to see if the spectral data is ready.
import time

dataready = False
while not dataready:
    dataready = AVS_PollScan(handle)
    time.sleep(measconfig.m_IntegrationTime/1000)
And now its time to grab the data!
timestamp = 0
spectraldata = []
ret = AVS_GetScopeData(handle, timestamp, spectraldata)
timestamp = ret[0]
for i,pix in enumerate(wavelengths):
    spectraldata.append(ret[1][i])
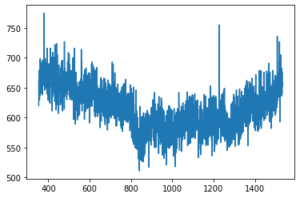
Finally, we can plot with matplotlib.
>>> import matplotlib.pyplot as plt
>>> plt.plot(wavelengths,spectraldata)